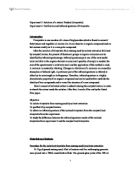
0.370 = 0.0231x + 0.0883
x =
= 12.19 kb
When y = 0.323
0.323 = 0.0231 + 0.0883
x =
= 10.16 kb
When y = 0.263
0.263 = 0.0231x + 0.0883
x =
= 7.56 kb
When y = 0.182
0.182 = 0.0231x + 0.0883
x =
= 4.06 kb
When y = 0.089
0.089 = 0.0231x + 0.0883
x =
= 0.04 kb
Discussion:
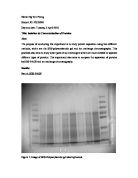
Base on the image obtained from the gel electrophoresis of the HindIII restriction digest of λ DNA, there are eight bands visible on the gel. However, for HindIII restriction enzyme there should be eight fragments, as it cuts the λ DNA into eight parts (Buxbaum, 2011), the other fragments are not visible on the agarose gel, and this may due to the low concentration of DNA and leading to unclear and missing in the observation. Besides that, it may also due to the staining of the gel is not sufficient to stain the other fragments, as they may be too small in size (Boyer, 2009).
Difference in number of bands observed may be due to the low resolution of the gel. Some factors affecting the resolution are gel thickness, length of the gel and heat dissipation (Nakai & Modler, 1996). When the gel is thin, resolution of the gel will be higher. As for the gel length, the longer the gel, the better the separation would be. When the voltage is applied to the gel, heat is generated at the same time. When the gel is running, overheating of the gel increases diffusion of the bands. Resolution hence reduced (Nakai & Modler, 1996).
From the practical, 7 fragments were found in the restriction digest at the figure 1 with the size of 25.05kb, 15.87kb, 12.19kb, 10.16kb, 7.56kb, 4.06kb and 0.04kb. It was expected 8 fragments to be occurred on the gel as the HindIII recognizes the sequence at 5’AAGCTT 3’ and will cut λ DNA into eight fragments which is at the size of 23.13kb, 9.416kb, 6.557kb, 4.361, 2.322, 2.027, 0.564 and 0.125kb. The result is not consistence with those expected as the fragment size observed was different to the expected. From the image of the agarose gel electrophoresis was observed, size fragment of the first band is 25.05kb which is closer to the theoretical result. However, the following 6 fragments have run at different size as compared to the theoretical result. Furthermore, there was a invisible of eighth band in the sample, this may due to the high concentration of the agarose gel which lead to unsuccessful separation as high concentration of agarose gel tend to be more frictional drag for the larger fragment in the gel (Buxbaum, 2011). There were a few glitches in the bands. Firstly, as seen in the HindIII bands, there were smudges, and this indicated that the separation was not clearly done. At the same time, the timing for the electrophoresis for HindIII could have been not enough; as a shorter timing for separation may lead to thick clumping bands and the smaller fragments were only the visible ones (Darling & Brickal, 1994).
Between these two separation methods, gel electrophoresis would be more suitable to separate nucleic acids. This is because the pores of filter paper strip in paper electrophoresis are very large; this separation method separates analytes on the basis of molecule charges (Buxbaum, 2011). Unlike protein molecules which have different charges due to the varied charge on amino acids R group, most nucleic acids have same net charge due to the phosphate group. In the large pores of paper electrophoresis, when voltage is applied, equally charged nucleic acids will move to the opposite pole at the same speed, without fragments being separated or only part of them will be separated. Hence, paper electrophoresis is more suitable to be used in protein molecules separation.
Whereas in gel electrophoresis, the pore size of the gel can be manipulated by changing the concentration of the agarose used. Charge on the analytes, too, is one of the factors affecting the distance migrated by the sample. Because of the variable pore size, this separation method can be used to separate nucleic acids, proteins and some other molecules.
Conclusion:
In conclusion, agarose gel electrophoresis can be used to separate fragments which are produced by the HindIII restriction digest of λ phage DNA. The sizes of λ DNA fragments being digested by HindIII are determined by the equation from the DNA ladder graph and there were only 7 bands were visible which are 25.05kb, 15.87kb, 12.19kb, 10.16kb, 7.56kb, 4.06kb and 0.04kb.
References:
Allen, G 2005, Separation and Purification of Peptides, Sequencing of Proteins and Peptides, Elsevier / North Holland Biomedical, Press, Netherland, p. 109.
Buxbaum, E 2011, Electrophoresis, Biophysical Chemistry of Proteins: An Introduction to Laboratory Methods, Springer Science + Business Media, LLC, New York, p. 67 – 68.
Boyer, R 2009, Biochemistry Laboratory – Modern Theory and Techniques, Pearson Education, Inc, San Francisco, pp. 176 – 177, 187 – 190, 201 – 203.
Darling, D.C and Brickell, P.M 1994, Nucleic Acid Blotting: The Basics, Oxford University Press, New York, pp. 11-14.
Nakai, S and Modler, H. W 1996, Analysis: Quantitation and Physical Characterization, Food Proteins: Properties and Characterization, Wiley-VCH, Inc., Canada, p. 368.
Westheimer, R 2001, Electrophoresis in Practice, 3rd edn, Springer Verlag, New York.
Pre-lab:
1. Factors affecting the molecule movement in paper electrophoresis are the charges, size and shape of the molecules. The greater the charge of the molecule, the faster it can move to the pole of its opposite charge. Besides that, the greater size of the molecules, the slower it can move in the gel. Molecule which has round shape will have less friction when moving in the pores of the gel hence can move faster (Westheimer, 2001).
2. Proteins are very huge macromolecules and most of them have more than 20 residues. Basically, pore size of paper electrophoresis is large but it only allows protein that less than 20 residues can be separated using this method (Allen, 2005). Paper electrophoresis is meant for smaller macromolecules like nucleic acid (Westheimer, 2001). If paper electrophoresis was used to separate proteins, most of the molecules would not be able to migrate. Hence, migration would not be able to occur (Westheimer, 2001).
3.
4.
5. 10mM = 10 x 10-3 mole/litre, 5µmoles = 5 x 10⁻⁶ mole
n = cv
5.0 × 10-6 = 10 × 10-3 (V)
V =
= 5.0 × 10⁻⁴ L