Limitations of this research include: -
Only measuring life events.
Asking participants to remember events from the previous year would produce unreliable subjective data.
Different situations could be different from person to person because not all-medical reports may be of the same age range.
The scale does not distinguish positive from negative, as the model assumes that any life change is stressful, without any supporting evidence.
As a result of the criticism of the SRRS Kanner et al 1981 produced a ‘Hassles and Uplifts’ scale. Number of researchers argued that daily hassles lead to more stress and therefore have a greater impact of physical and mental health than life events. Kanner devised a hassles and uplifts scale consisting of 117 hassles, 100 middle-aged adults completed the scale each month for nine months. It was found that Hassles score showed better predictions of psychological problems, i.e. depression and anxiety.
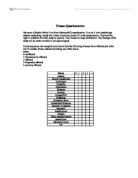
The aim of this experiment is to find if there is a relationship between stress and illness in 16-18 year olds. We are investigating into how this age group deals with the hassle’s put to them and how they cope. I expect to find that the more hassles a student has to deal with the immune system may seem to fail or the body becomes more prone to illness.
My experimental hypothesis is that ‘There will be a significant relationship between a participant’s score on the hassles scale and their physical health. Participants who score highly on the hassle scale will be more prone to illness.’
My null hypothesis is that ‘ There will be no significant relationship between a participants score on the hassles scale and their physical health.’
Method
Design:
Two questionnaires will be used; one based on participant’s stress and the other on the participant’s illness. We will be finding a relationship between these two variables. We are going to use a correlational analysis for analysing data rather than a research method as such. We are using correlational analysis as it can be used for analysing data produced by questionnaires. Correlational analysis is going to be used, as it is an easier analysis of stress and illness than researching in a laboratory environment. As it is a statistical technique, it will measure the strength of the relationship between stress and illness.
Ethical considerations include that participants will know that all results will be confidential, as no personal details will be required. There will be some form of Deception so participants will not know the variables investigated to get the participants in their natural state. To overcome this we will debrief all the participants at the end. Also participants are given the right to withdraw at any time, they will be informed that they can stop answering questions at any time.
Participants:
Researchers conducting this study are four A’ level psychology students. Number of participants used is 28, this will be split into 14 females and 14 males aged 16-18, all participants are from Alton College. We will select our sample using an opportunity sample from the target population. Participants will be given at random a questionnaire first so some will get the stress questionnaire first and some will get the illness questionnaire. I will be using an opportunity sample, as I will be selecting the sample from students who are willing to take part.
Apparatus/materials:
Hassles questionnaire (see appendix 1)
Health questionnaire (see appendix 2)
Mark scheme for hassles questionnaire (see appendix 3)
Mark scheme for health questionnaire (see appendix 4)
Consent form (see appendix 5)
Debriefing sheet (see appendix 6)
Standardised procedure:
Step 1: Using opportunity sample select participants.
Step 2: Participants will be told they will be doing a questionnaire asking about their health and the hassles that they experience.
Step 3: Verbal consent will be taken and the consent form will be signed. Confidentiality will be explained to the participants.
Step 4: Administer the first questionnaire.
Step 5: Administer the second questionnaire.
Step 6: Debrief the participants at the end, reveal any deception, and thank them for taking part.
Controls:
The main extraneous variable that could affect the results is how truthful the participants are. To try to control this I will encourage the participants to be truthful and explain that the research is a large percentage of our final A2 marks. It will be made sure that they are fully aware of confidentiality of their information, no personal details will be taken. It will be ensured that participants are not psychology students so it will be less likely to bias our results. Participants will do the questionnaire in a quiet area.
Results
I chose to use the median to find the middle value of all my results. I also used it as I am using ordinal level data, as I cannot be sure that the data is measured in fixed units. The advantage of using the median is that it will remain unaffected by any outlying results. It measures the central tendency of my set of results.
The Statistical Test I have used for my results is the Spearman’s Rank Order Correlation test. I used this test because I am using ordinal level data and I am testing for a relationship/correlation between health and hassles.
The results of this test are shown below: -
∑ D2 = 2135.5
Formula rs = 1- 6 x ∑ D2
N (N2-1)
Rs = 1 - 6 x 2135.5
28 (282-1)
Rs = 1 - 12813
28 x 783
Rs = 1- 12813
21924
Rs = 1- 0.584 = 0.416
Observed Value = 0.416
Critical Value = 0.317
Statement of Significance:
As the observed value of rs = 0.416 is greater than the critical value of 0.317 (when N=28, P<0.05, and is a one tailed test), the likelihood of these results occurring through chance is less than 5%. In this case, the null hypothesis can be rejected and in favour of the alternative hypothesis as the observed value is greater than the critical value.
This means that there is a positive correlation in my results and it shows that health is affected by number of hassles in most cases.
Discussion
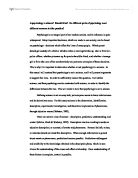
What we have found is a positive correlation in the results taken from the experiment, which shows that the higher the hassles score the higher the health score. This is not a true statement in all cases, as everyone is individual proving that some people may be able to cope with stress better than others are. There was a few individual results that showed high hassles score but quite a low health score which shows that participant may be able to cope with stress easier than others as they may be able to control their arousal levels. The original hypothesis stated that, ‘there will be a significant relationship between a participant’s score on the hassles scale and their physical health. Participants who score highly on the hassles scale will be more prone to illness’. This hypothesis was accepted as results supported this argument. By accepting this hypothesis it proves that students/participants that have less stress and hassles in their lives are physically healthier due to the immune system and body working together to overcome the stressors.
Marmot et al.’s 1977 did a piece of research into workplace stressors. He took a sample of civil servants aged 35-55 and conducted a longitudinal study, they recorded the workplace state and the stressors within using questionnaires and observation. Job control was assessed which was then put into a correlational analysis with stress-related illness. This is similar to my experiment apart from the age range and setting is different. This study showed that ‘participants that show low job control were four times more likely to die of a heart attack than those with high job control’. This ties in with my experiment that if students have low control on their hassles then they are more likely to come across stress-related illnesses than students with more control do.
If I were to repeat this study in the future, I would use a different type of sampling than opportunity. By using an opportunity sample it cannot be generalised to a wider population as it is unrepresentative and can be biased by the type of people who the researcher ask. I would use a systematic sample where not every person has an equal chance of being selected but is an unbiased selection method. I would also give each participant the hassle questionnaire first then the health questionnaire second, as it was a slightly unfair and was not properly sorted out. I would take each participant into a silent room instead of just a quiet room so the participant had no distractions and was fully concentrating on the questionnaires. On the questionnaires
Follow up research could include looking at different gender types, to see if female cope better with stress than men or the other way round. Also research into time of the year for students, for example do research when they are in a not so crucial time, then do the same experiment at time of the exam period.