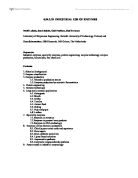
Each amino acid has an isoelectric point (pI) this is the point at which the molecule has an average net charge of zero, this is the pH level at which there is no migration in an electric field. A zwitterion is an amino acid which contains both negatively charged and positively charged groups (see fig. 2.) As they are electrically neutral there is no migration in an electric field.
Fig 2. A Zwitterion
The pI is calculated by averaging pk’ values in two functional groups that react as the zwitterion becomes alternating a monovalent cation or a monovalent anion. To minimise convection currents diffusing molecules into the buffer system, the support media polyacrylamide gel is used therefore the process is known as polyacrylamide gel electrophoresis (or PAGE.)
PAGE is often used in electrophoresis as it provides a high resolution in the separation of proteins another advantage over other methods is that the gel pores can be tailored to suit the protein being separated. This can be used when little molecule sieving is required as the pores are simply made larger to allow them to pass. Another advantage is that it is chemically inert and therefore unaffected by conditions of extreme pH, ionic strength and temperature.
At completion of the experiment it is necessary to view the separated proteins and as proteins are generally colourless it is necessary to stain them so as to be visualised. An example of a general protein stain would be coomassie blue; bromophenol blue is used as a tracking dye and as the marker in polyacrylamide gel electrophoresis.
Serum is generally used in PAGE instead of plasma as fibrinogen which is found in plasma can leave a narrow band in the β-region and this can be mistaken as a sign for monoclonal paraproteinemia. It is the banding pattern of the proteins which shows the amount of separation and thereby the amount of movement of substance. This can be expressed in terms of its relative frontal motility (Rf) value, which is calculated by the following equation:
Rf = migration distance of the band
Length of the gel
This eq uation shows that proteins which have a strong interaction with the stationary phase of the chromatographic system will not travel very far moving slowly through the gel, whereas those with the least interaction will travel the furthest.
The aim of this experiment is to identify serum proteins from a sample by means of PAGE, then by means of the above equation identify those which have the least interaction, and thereby obtaining the Rf value of each band.
METHOD
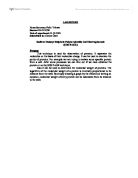
Gloves were worn throughout this experiment. The serum was prepared by mixing 0.1 of serum with 0.1 ml of 0.25% (w/v) bromophenol blue in 50% (w/v) aqueous sucrose into a microfuge tube, which was then whirlimixed. The sample then has to be inserted into the electrophoresis tank (see fig 3.) this is achieved by firstly removing the parafilm from the tube, then inserting the glass tube containing polyacrylamide gel rod into the electrophoresis tank.
Tissue was used to dry the surface of the gel with the buffer being poured into the tank to fill the upper compartment. With a Pasteur pipette all air bubbles are removed. 20μl of the sample was then loaded on top of the gel, the tank was then switched on.
After electrophoresis the polyacrylamide gel rod needs to be removed from the glass tube, this is done using a syringe and water to reduce the forces holding the gel in place. For the staining process to be carried out the gel was place into a 50 ml beaker and covered with Reisner’s stain. This beaker was then left for 20 minutes to allow the due to penetrate the gel. The dye was then decanted off and the gel observed on a white tile or light box.
Fig 3. Electrophoresis Tank
RESULTS
Table 1 – Band distances and identification
Migration distance = distance travelled by a band (cm)
Rf = migration distance of band
length of gel
Rf values for bands:
1: 5cm = 0.51
9.9cm
2: 2.2cm =0.22
9.9cm
3: 0.9cm =0.09
9.9cm
4: 0cm =0
9.9cm
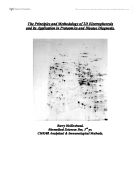
Table 1 displays the migration distance, the Rf value and the identity of each of the protein bands which were obtained by electrophoresis. As band one had a migration distance of 5cm when divided by the length of the gel (9.9cm) it has an Rf value of 0.51. As it was the largest of the bands in the gel it is recognised as Albumin that being the main protein constituent.
As the table shows, the band which moves the furthest along the gel was the bromophenol blue band which was band number 5. This is the tracking dye and acted as the marker for electrophoresis therefore moving the furthest. The band which migrated the least was number 4 in the gamma zone as this stayed at the origin of the sample.
Following the table is a list showing the Rf values for each of the bands which is achieved by using the formula mentioned in the introduction. Figure 4 is a diagram of the gel showing the bands that were produced through electrophoresis, the band numbers and possible identifications of the proteins are also shown.
Fig 4. Polyacrylamide gel and bands
DISCUSSION
The polyacrylamide gel electrophoresis showed that the protein to migrate the furthest was the serum albumin having the highest Rf value at 0.51. The reason for this being that serum albumin is the main protein constituent and therefore is also the largest band.
The alpha zone was found to move the second furthest and the beta zone moving the third furthest. The band which remained on the origin was the gamma zone. The bromophenol blue (BPB) migrated the furthest travelling almost the length of the gel, this is due to it being the tracking dye and therefore acting as a marker for the electrophoresis.
The reason the serum albumin migrated towards the anode is because it is a negatively charged molecule (anion), the reason it moved further (or faster) to the anode than the other zones such as the alpha and beta is due to it being a highly charged molecule. The alpha and beta are charged but to a lesser degree. As the gamma zone did not move from the origin it confirms that it is not negatively charged, although it cannot confirm whether it consists of positively charged molecules (cations) or neutrally charged (zwitterions.)
Polyacrylamide gel electrophoresis (PAGE) was the method used in the experiment; this has advantages over other forms of electrophoresis as it is a versatile system in that it is chemically inert and remains stable in situations of variable temperature, pH and ionic strengths.
The main advantage PAGE has to other forms of electrophoresis is that it is possible to change pore size and thereby alters the level of “sieving,” so that larger molecules can be migrated with more ease or difficulty depending on what is required.
Upon analysing the results obtained by the experiment, the data obtained confirms what was expected in that the proteins with the highest charge migrated the furthest along the gel.
Another method which could have been used would have been gel filtration (or molecular sieving.) With this method a column is filled with hydrated insoluble gel particles with known pore samples. Protein is then passed through this column, with the effluent solution collected thereby containing the solutes in their differing sizes. This is an experiment to be considered in two phases, the gel phase (within the pores) and the solvent phase (outside the gel particles.) Although gel filtration is an effective method used in the purification of proteins it is not possible to tell things such as ionic charge and therefore not practical for getting the data required in this experiment.
In conclusion, as expected the bands that were negatively charged (anions) moved towards the anode with the serum albumin was the largest band as it is the main protein constituent, and it was also the protein with the highest negative charge.
References
R. Reed, D. Holmes, J. Weyers & A. Jones
Practical skills in Biomolecular Sciences
Addison Wesley Longman Limited 1998
Metabolic Biochemistry (BMS 203)
Module Guide 2004/5
University of Sunderland
Molecular Biochemistry (BMS 203)
Lecture Notes
University of Sunderland