To ensure that the results are reliable the same considerations need to be applied. Everyone will have the same amount of chances i.e. 5 catches per person. They also have to be given the same amount of time to complete the test. All test subjects will be treated with the same care as the next person, and no favouritism towards one participant compared to another participant.
The apparatus that is needed to perform the investigation is as follows:
- Participants for investigation
- Ruler
- Pen
- paper
All the results that are gathered from each participant will be totalled and an average taken from that result. The results will be in cm and then converted into milliseconds from the reaction time table. The results will show how well each person did, and how quick or slow each person’s reactions times are when comparing them to the table.
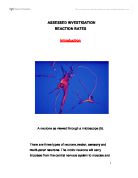
The scientific theory behind the investigation is the REFLEX ARC. One of the simplest situations where impulses cross synapses to produce action is in the Reflex Arc (3). A reflex action is an automatic response to a stimulus. When a particle of dust touches the eye, you will blink; or if a particle of food touches the lining of the windpipe; you will set off a coughing reflex. You can not stop these reflexes, even though you would be aware of these reflexes happening. The reflex arc needs only one synapse for making a response. Most other reflex actions need many more synapses to adjust other muscles in the body and to send impulses to the brain (3).
THE REFLEX ARC
The predictions that I expect in the investigation are based on previous experiments to test reaction rates. A similar test to the one being conducted by my participants was also conducted on a number of participants to see how quick they respond to catching a ruler (4). The participants were tested before and after they consumed alcohol, to see how they would perform under different test scenarios. The results were recorded before and after they had taken alcohol, and placed in a table.
The measured variable was how their reactions changed after alcohol was consumed, and this could also suggest that it is very important not to drink before driving a car as it slows your reaction time, and this would inhibit stopping distance, and could cause a road accident to happen.
The method in the experiment has gave a good background of what is expected in my own investigation as it is detailed enough to follow on from and shows how the experiment should be conducted.
Method
The participants that were asked to take part in the investigation were required to catch a falling ruler to see how quick their reaction time was.
The investigation required the participants to lightly grip the ruler at the zero position, and my job as the experimenter was to hold the ruler at the top end. When prompted, I dropped the ruler and the participants were required to catch the falling ruler as quickly as possible. Each participant was asked to catch the ruler at least 5 times, to see how different their reaction times were each time they were tested.
After each catch their results were recorded on paper for analysis and transferred into a table for the results section. The results were measured in cm and then converted into milliseconds, by taking the data from the conversion table.
Results
The results were gathered from adults and children and they show that there is a difference between the 2 groups. These differences can be seen in the tables and charts from the data collected from the participants.
Table 1
Table 1 shows all the results that were recorded from Group (A). The table shows the age, sex, catch average, and converted catch result of each participant.
Table 2
Table 2 shows the same results as recorded in the Group (A) table. These are the results of Group (B). The table shows each result from the participants, catch average and converted catch average.
All the scores were totalled and calculated into a T-Test formula. The results are shown below in table 3.
Table 3 T-Test
The t-test shows that the there is a significant difference in the results when comparing them to the probability level. The results are much lower than the probability level of 0.05.
A line graph was also completed to show the difference in the catch average of the two groups (A) Young and (B) Old. The graph showed that there was a noticeable difference between the two conditions, in their scoring average.
Conclusion
When the investigation was completed, the results were evaluated and placed into tables and graphs. All the scores from the participants in each condition were calculated and averaged to show an overall mark, which was then transferred into the tables and graphs.
Table 1 shows a breakdown of the completed results from Group A (Young) and show the calculated average catch in cm and then the catch converted into milliseconds to give the exact reaction rate that was achieved by each participant. Table 2 shows the same information for the results of Group B (Old).
From the results of the investigation, I was able to determine that I could reject the Null hypothesis as the probability result from the t-test was very significant.
The t-test showed that the result was less than the probability result of 0.05. This result confirms that the Null hypothesis could be rejected, and the Alternative hypothesis be accepted.
- There will be a significant difference in reaction rates between young and old.
A two-tailed test was used in the t-test to calculate the end result of 0.014856 (see table 3). This shows there is a difference in the reaction rates of the 2 conditions that were tested - Group A (Young) and Group B (Old).
A line graph (see graph 1) was also completed to show the catch average for each participant, and shows how different the results ranged between the 2 groups.
As expected before the investigation, the participants belonging to (Group A) had quicker reaction rates on average, when comparing them to the participants in (Group B). This then proves that children react quicker than adults. Though many of the results gathered from the participants in each condition could prove that this is not the case, as their scores were quite similar between the 2 groups.
Many of the participants that scored around the same in average, in both groups – quick reactions – slow reactions could show they were maybe similar in their hand – to – eye coordination reactions.
The participants that averaged a slower reaction time in the investigated test could be tested again, to see why their results were much slower, when comparing the results of the quicker reaction times.
Though many reasons could explain why the Young and Old participants scored similar. A physically active person would have better reactions, if they participate in playing video games or sports, such as tennis or squash. They could react much quicker than a person who doesn’t participant in physical sports or exercise, as they would have quicker movements and would be able to react much faster, unlike a less active person.
Evaluation
Many variables needed to be controlled better in the investigation. Some participants were tested at night, and I found that they were scoring higher reaction rates in cm instead of lower measurements in cm.
They were slower to catch the ruler when it was dropped from the starting point. Many of the participants tested in evening hours, dropped the ruler completely and had to be tested again.
This shows that tiredness can affect your reaction rates, and that people without enough sleep can cause accidents when driving on the road or operating machinery.
If testing the participants again, it would be better to test them within the daylight hours, when sleep should not affect their reaction result. This would then show if sleep does affect people’s reactions times. If I repeated the investigation on the participants within my study, I could see if the Younger or Older individuals would react any different under these circumstances.
References
1. (G&S) Toole Understanding biology for advanced level 4th edition, Nelson Thornes, United kingdom 1999, ISBN 0-7487-3957-2, Pages 526 and 541
2. The nervous system, 14th March 2005
3. (D.G) Mackean GCSE biology 2nd edition, Butler & Tanner Limited, London 1995, ISBN 0-7195-5302-4, Pages 181-184
4. Class handout ‘The effect of drinking alcohol on the speed of response’
5. Webster’s World Encyclopaedia 2004 CD Rom, An image of a neurone