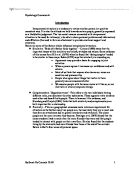
Hypotheses
Null- hypothesis
"There will be no difference (distortion) between the verbal labels in the abstract figures reproduced by the two groups.''
Experimental hypothesis
"The abstract reproduced figures will be significantly distorted towards the written verbal labels in both groups."
The reason that a one tailed hypothesis was used was because by looking at other experimenters results, it could be clearly seen that there will be a significant difference to the results obtained. It was very appropriate using a one tailed hypothesis; as it is the only type of hypothesis that predicts an effect in a particular direction.
Method
Design
The researcher used independent measures design in this experiment. This is because it is an experimental design where different participants are used for each condition in the experiment, one group receives the experimental treatment, the same images for each group with a word underneath each picture, and the other group (the control group) receives a different experimental treatment with a different verbal use. Matched pair design could not be used, as it would be too difficult to find people of similar backgrounds, race and culture. An independent measures design does not have these carry-over effects; therefore it was very suitable to the experiment conducted.
Independent variable
The independent variable (IV) is a feature of the experiment that is manipulated by the researcher in order to observe whether a change occurs in the dependent variable (DV). In this experiment the independent variable is the set of cards given to the participants. Group A and Group B had the same set of cards (8 cards altogether) with the same images, pictures, but with a different verbal label underneath each picture.
Dependent variable
The dependent variable (DV) is the experimental variable that is measured by an experimenter, to asses the effect of the independent variable (IV). In this experiment the dependent variable is the number of words and images recalled in one minute and thirty seconds by the participants; this will be measured by investigate the effect of language on the reproduction of a series of abstract figures.
Confounding variable
A confounding variable is variable that is not intended independent variable but which has an effect on the dependent variable. This could occur if the variable in question is mistakenly manipulated or allowed to vary along with the independent variable. If a confounding variable is controlled than it is called an extraneous variable.
Extraneous variables
Extraneous variable are any variables in a study except for the independent and dependent variables. Extraneous variables need to be controlled. If they are not controlled they may obscure the effect of independent variable and turn into a confounding variable.
In this experiment, as it was carried out during school time and in a classroom, the researcher made sure that the experiment was given enough time; so that bell for the next period did not go on during the experiment. The researcher made sure also that a sheet of paper saying '' An experiment is taking place, please do not disturb'' was hanged on the outside of the classroom door; this was to make sure that no one entered the room while the experiment is taken place. The reason that these two variables were controlled is because it could have influenced the participants' concentration.
Target population
Overall 24 participants between the ages of twelve and thirteen years old were chosen. All participants were female, and were attending the same school; Hornsey School for Girls, in the same year, year eight and the same tutor group, The reason that the researcher choose year eights was mainly because the participants were naïve (they have not taken part in any psychology experiment before) and participants may not be as experienced in memory techniques as other participants.
Sampling method
Opportunity sampling was used to conduct the experiment. The researcher approached the first twenty-four (in year eight) who agreed on taking part in the experiment (by signing a participant consent form (see appendix two). To avoid biased the researcher conducted the experiment on participants whom the researcher did not know. The reason that this sample was used was because it is the most commonly used method and because it is easy in terms of time and therefore money. It is more biased than random sampling, as you do not know if the ones chosen represent the population.
The researcher used the following apparatus and materials in order to conduct the experiment in the best way as possible:
- A standardised instruction sheet which described the experiment in very little detail was used so that participants read and followed instructions given.
- In order to control the time a stopwatch was used.
- An envelope that contained eight cards (that had to be memorised) of pictures which were drawn by the researcher, was given out to each person in each group.
- An exercise sheet with four different questions was handed out to each participants so that they could be deterred of what they have memorised.
- Response sheets were also handed out in order for participants to record their answers on.
- Pencils were given out to each participant so that they all had something to write with.
- A debriefing sheet was also given to each participants this was done to inform the participants of what the aim of the experiment was and to thank them for taking part in the experiment.
Procedure
Twenty-four participants were asked to take part in the experiment to which they consented by the head of year eight and their tutor. Once they all had agreed to take part in the experiment they were randomly divided into two groups. The first twelve participants were allocated to Group A and the next twelve participants were allocated in Group B. Participants were then seated in a well-lit classroom. Participants were then given a standardised sheet, which was read out to them by the researcher (appendix three). Two other sheets were given to each participant, on which they were asked to write their answers later on in the experiment. Each set that was given to the participants during the experiment is located in appendix eight.
All participants were informed that they were taking part in a psychology experiment exploring memory. The researcher explained that they could withdraw from the experiment at any time before, during or after the experiment. Each group contained 12 participants. Both groups were in the same room and took part in the experiment at the same time. Each participant in Group A and Group B was given the same set of cards with the same set of images, but with different verbal label underneath the image, the groups were told not to turn over the cards until they were advised to do so by the researcher. There were eight cards altogether; each set of cards was put into an envelope. There were twelve envelopes for group A and twelve envelopes for Group B, so there were twenty-four envelopes altogether.
After each participant was clear about what was required of them, they were told to turn over the set of cards and look at the first card for ten seconds and try to memorise it. The researcher started the stopwatch, and after ten seconds they were told to put the card aside and look at the second card for another ten seconds, this was repeated till the last card has been memorised. Participants were then told to put cards back into the envelope and to turn over appendix four , their task was to spell 'happy birthday' backwards three times, and to have a go at the three maths questions and not to worry if they could not answer all the questions. Participants were given exactly four minutes to do this. This was done to deter the participants from what they have memorised. Four minutes later participants were asked to put appendix four away and to turn over appendix five and draw each image that they could remember and to write down as much as they can remember under each image that they have memorised from each card. They drew and wrote their answers on appendix four. They did this as a free recalling; they did not have to put it all down in the same order in which they have seen it in, they could put it down in any order in which they wanted to. Participants were given a minute and thirty seconds to do this. After the participants had done this, all of the materials were collected and the participants were fully debriefed by the researcher using detailed written and verbal debriefs (also located appendix six).
The researcher explained what the purpose of the experiment was; to explore memory and investigate the effect of language on the reproduction of a series of abstract figure (pictures). It was also explained that Group A and Group B had the same set of pictures but with different words underneath each picture. At the end of the experiment the researcher asked if anybody had any questions or wished to comment on anything while they were still in the room, participants were then thanked for taking part in the experiment.
All the participants left the experiment in the same state in which they have entered it; this is because and the researcher was friendly and approachable also because participants were treated ethically during the experiment i.e. they were told what the experiment was about, they were asked if they wanted to take part in the experiment, they were informed that they could withdraw from the experiment at any time during the experiment and that all the information obtained will be held confidential. They were treated with respect and given a choice; participants were also not put under any pressure.
Ethical considerations
Before conducting this experiment, ethical issues were considered.
One of the main ethical considerations was to give participants the right to withdraw at any time before or during the experiment if they felt uncomfortable. Only the people who were willing to take part in the experiment were the ones that were tested; no one was forced into taking part in this experiment.
Participants must not be deceived; the researcher must not withhold any information or mislead participants. Participants must not be told that the research is about one thing and the researcher is testing for something else.
Another ethical issue that needs to be considered is the Debriefing of the participants. The researcher must inform the participants more than just what the experiment is about. Participants should be informed of the true aims of the experiment. The participant should be given an opportunity to express any concerns about the experiment and advised of her right to withhold data (contained in appendix six). The researcher should try to reduce any stress caused by the experiment.
The consent of the participants was obtained by the participants themselves, by their class tutor and by their head of year (see appendix one A and one Band appendix two). Participants were fully informed about the experiment i.e. why the experiment is actually being conducted.
Another important ethical issue is the confidentiality and privacy of the participants; any information provided by them will be treated confidentially and their identities will not be revealed.
Participants were also given the opportunity to ask any questions about the experiment after they had finished.
Results
The participants' results for this experiment were put into a raw data results table (page thirteen) The mean, median, mode, range and standard deviation were all calculated from the results (see appendix seven) for calculations). Each participant was rated individually on a rating scale of 1-5 (rating scale located in appendix seven).
The mean (average) and median were both slightly higher in Group A. Group A has a mean value of 3.33 and a median value of 20. Group B however has a mean value of 3.17 and a median value of 19. This clearly shows that there is a normal distribution between both groups; the bell-shaped frequency distribution in which most of the scores are close to the mean.
From looking at both values Group's A and Group's B. It is clearly stated that language does have an affect on the reproduction of abstract figure. Language affected Group B more than Group A, this is shown in the mean and median; they are both very low. Group A was not affected as much as Group B did; this is also shown in the mean and median value. The graph below shows the mean, median, mode and range values for both groups.
The results of an experiment on the effect of language on the reproduction of a series of abstract figures.
Below is another graph for Group A and B showing the standard deviation for both Groups. From the graph it is clearly seen that the standard deviation for Group B is slightly lower than the standard deviation for Group A, indicating that the participants in group B were affected by the verbal label than the participants in Group A did. This could be because participants in Group A memorised (rehearsed) the image and the verbal label and when they were asked to put down everything they have memorised on the sheet of paper, they recorded what they have memorised; they were not affected by language. Participants in Group B however memorised the image and the verbal label but instead of recording what they have memorised they were affected by language.
A graph showing the standard deviation for Group A and group B
A table showing the results of the effect of language on the reproduction of a series of abstract figures.
Group A and B were given the same set of pictures, but with different verbal labels underneath each picture.
Another results table is on page seventeen showing the exact results as in the table above.
The table below shows the mean, median, mode, range and the standard deviation value for both groups
The mean, median mode, range and standard deviation for the experiment conducted; the effect of language on the reproduction of a series of abstract figures.
Discussion
From looking at the results it can be seen that the hypothesis "The abstract reproduced figures will be significantly distorted towards the written verbal labels in both groups'' was correct. The researcher has reached this conclusion by looking at the mean and standard deviation value for Group A and B. The mean in Group B was slightly lower than the mean in Group A so was the median, which means that the memory of the participants in group B was affected by language whereas participants in Group A were not.
The mode in both groups was 3 which indicated that the results were similar to both image and word (the verbal label); both groups were equal here as the mode was the same. The median in both groups was different however; the median in Group A was 20 and the median in Group B was 19, not very much could be said by the researcher here either as it clearly there is a normal distribution as there was no great difference between both results.
This study is very similar to research carried out by Carmichael, Hogan and Walter (1932), they used different abstract figures and word lists. Results can not be compared however as the sample of participants in this group could have been biased whereas Carmichael, Hogan and Walter's may not have been. Results can however be analysed and confirm whether language affected thought (which did do).
One of the main methodological limitations of this study was that the testing of the participants was conducted in a classroom where uncontrollable variables could have easily arisen. For example there could have been a distraction in the surroundings around the classroom in the form of noise (shouting, running, laughing and so on). This would have interfered with the results obtained. Another criticism of the study is that the experimenter made used of a biased sample, therefore this could have caused the significance of the effect of language on thought to be higher than it should have been. A further main methodological limitation could have also been with rating scale; as it was very difficult to rate the reproduced abstract figures on such a small rating scale, causing the results to be higher than they should have actually been.
An improvement to this study could be done by conducting the experiment in a quite room at a good time during the day and by conducting the experiment on one group at the time. Another improvement could also be done by increasing the ratings scale from 1-5 to 1-10. This would mean that the independent judges would be able to distinguish where one category begins and where one category ends. To avoid biased the experimenter could ask five people to rate the participants results on the rating scale. Biased will be avoided as the five judges would mark the figures on the distortion that was in evidence rather than the distortion they would have expected to find.
A suggestion for further research is by using one picture list and a word list to see if language has an effect on thought for other words and figures rather than the ones that were tested. Another suggestion is using different age range and mixed genders, this could happen only by keeping the number of males and females the same as it would be very interesting to compare the opposite sexes results. By doing that the researcher would be able to see whether gender has a role to play in the effect of language on thought
Conclusion
It can therefore be concluded from this experiment is that the experimental hypothesis for this experiment was correct "The abstract reproduced figures will be significantly distorted towards the written verbal labels in both groups." The aim of this experiment was also met; this experiment did support the Whorfian Linguistic Relatively Hypothesis; language does determine thought. Group A had higher results than Group B did which meant that group B was affected by language.
The memory forms a mental image of the verbal label which makes the participants visualise the image of that certain label in their heads rather than just looking at the picture and memorising it.
References
Malim, T and Birch, A (1998) Introductory Psychology, Palgrave.
Gross, R (2001) The Science of Mind and Behaviour, GreenGate.
Eysenck, M W, Keane M T, (1995) Cognitive psychology, Psychology press Ltd Publishers.
Appendix index
Head of year and tutor's consent letter 17 & 18
Participants consent 20
Standardised Instructions 21
Work sheet (to deterrence participants) 22
Response sheet 23
Debriefing sheet 24
Calculation of results 25
Set of cards given to participants 26-29
Appendix one A
30/01/2003
Dear Mrs Guy,
I am writing to you as a post 16 student doing As psychology. In order to complete this course I need to conduct an experiment exploring memory. I would like to use the year eights for this experiment, with your permission of course. The participants will be collected by opportunity sampling (the researcher approaches the first twenty-four students who agree on taking part in the experiment).
The experiment will have two independent groups (twelve students/participants) in each group. Group A and Group B. Each group will be given the same sets of cards with the same image but with different words underneath each set of cards. I will follow the guidelines of the British Psychological Society (BPS) so that no physical or emotional harm is caused to any of the participants. Participants will be informed with their right to withdraw so that they do not feel under pressure during the experiment at any time.
Please feel free to contact me for any further information at any time on:
07903203477.
I will be really grateful if you give me your permission to conduct this experiment by signing below.
Yours faithfully
Mariam El Khalaf
Head of year eight's signature:
Appendix one B
30/01/2003
Dear Mrs Sirdaw,
I am writing to you as a post 16 student doing As psychology. In order to complete this course I need to conduct an experiment exploring memory. I would like to use the year eights for this experiment, with your permission of course. The participants will be collected by opportunity sampling (the researcher approaches the first twenty-four students who agree on taking part in the experiment).
The experiment will have two independent groups (twelve students/participants) in each group. Group A and Group B. Each group will be given the same sets of cards with the same image but with different words underneath each set of cards. I will follow the guidelines of the British Psychological Society (BPS) so that no physical or emotional harm is caused to any of the participants. Participants will be informed with their right to withdraw so that they do not feel under pressure during the experiment at any time.
Please feel free to contact me for any further information at any time on:
07903203477.
I will be really grateful if you give me your permission to conduct this experiment by signing below.
Yours faithfully
Mariam El Khalaf
Tutor's signature:
Appendix two
I, the participant declare that I am willing to take part in this experiment, which is to be conducted (carried out) by Mariam El Khalaf. This is after I was informed that my details will not be given out and that my confidentiality is withheld.
Appendix three
Standardised Instructions
Thank you for coming. An experiment is to be carried out to explore memory, to say that you agree on being in this experiment please sign the sheet of paper, which is going around the room. Could you please bear in mind that if you feel uncomfortable at anytime during the experiment, you have the right to withdraw (leave the experiment). Please note that all results will be kept in the strictest confidence
Appendix four
Spell happy birthday backwards three times:
Solve the following sums:
Appendix five
Appendix six
Debrief
Thank you for taking part in this experiment. The aim of the experiment was to investigate the effect of language on the reproduction of a series of abstract figures (pictures) i.e. the effect of language on image. This was done by splitting the participants into two groups; Group A and Group B. Each group received the same set of pictures, but with different words underneath each picture for each group. If after reproducing the pictures they are distorted (changed) towards their given verbal label then the experiment will show that the language does have a significant effect on the reproduction of series of the abstract figures.
Your data will be collated along with the data of the other participants and will be kept in the strictest confidence. If anyone does not want her results to be forwarded or to be used in this experiment please say so now so that it is gotten rid of in front of the participant.
Please ask the researcher if you require any further information or have any other comments.
Appendix seven
Calculations of results:
The formula for the mean is: ∑×
N
To get the mean the total results (40) is divided by 12 (the number of participants in Group A) 40/12 = 33.3. The median is found by dividing the results obtained by two; 40/12 = 20. The mode (the number that occurred the most) is 3 and the range is found by taking away the lowest number from the highest number; 5 – 1 = 4.
The overall for Group B is 38. By following the same steps that were done in Group A the researcher was able to find out the; mean (38/12) is 3.2., the median is: 38/2 = 19, mode; 3 and the range is 5 – 2 = 3.
Below is the scale which was used in order to obtain the results, as shown on the scale; 1 is given to the participants who were not affected by the verbal label and 5 is given to those participants who were affected very much by the verbal label. The numbers in between 1 to 5 are either similar to the original image, similar to both image and verbal label or similar to verbal label only.
Standard deviation is a measure of the spread of a set of scores. The difference between each score and the mean is computed and squared. These squared differences are totaled and divided by the number of scores. The square root is then taken of the result.
The formula for the standard deviation is:
∑ (× - ×) 2
N
The scale rating for the participants in Group A:
- 5,2,3,4,5,5,1,3,4,3,3,2
Mean = 40 = 3.3
12
- Subtract each number by the mean:
- 5 – 3.3 = 1.7
- 2 – 3.3 = 1.3
- 3 – 3.3 = 0.3
- 4 – 3.3 = 0.7
- 5 – 3.3 = 1.7
- 5 – 3.3 = 1.7
- 1 – 3.3 = 2.3
- 3 – 3.3 = 0.3
- 4 – 3.3 = 0.7
- 3 – 3.3 = 0.3
- 3 – 3.3 = 0.3
- 2 – 3.3 = 1.3
- Square each result from step 2
- 2.89
- 1.69
- 0.09
- 0.49
- 2.89
- 2.89
- 5.29
- 0.09
- 0.49
- 0.09
- 0.09
- 1.69
- Add all the squared numbers from step 3 together:
18.68
- Divide 18.68 by 12 = 1.55666667
- Square root 1.55666667 = 1.25
Standard deviation for Group A is 1.2 5
The scale rating for the participants in Group B:
- 3,3,3,2,5,3,3,4,2,3,3,4
Mean = 38 = 3.2
12
- Subtract each number by the mean:
- 3 – 3.2 = 0.2
- 3 – 3.2 = 0.2
- 3 – 3.2 = 0.2
- 2 – 3.2 = 1.2
- 5 – 3.2 = 1.8
- 3 – 3.2 = 0.2
- 3 – 3.2 = 0.2
- 4 – 3.2 = 0.8
- 2 – 3.2 = 1.2
- 3 – 3.2 = 0.2
- 3 – 3.2 = 0.2
- 4 – 3.2 = 0.8
- Square each result from step 2
- 0.04
- 0.04
- 0.04
- 1.44
- 3.24
- 0.04
- 0.04
- 0.64
- 1.44
- 0.04
- 0.04
- 0.64
- Add all the squared numbers from step 3 together:
7.68
- Divide 7.68 by 12 = 0.64
- Square root 0.64 = 0.84
Standard deviation for Group B is 0.84