Materials & Methods
This experiment was performed exactly as described in section 6: osmosis of the Fall 2011 BIOL 130L lab manual from pages 43-47 without any deviations.
Results
Table 1. Raw data of the weight of 5 different dialysis bag solutions over a 40 minute period
This table compares how the weight of each dialysis bag changes every 5 minutes over a 40 minute period with respect to the different concentration of solution inside the bag and the concentration of fluid surrounding the bag within each beaker. Dialysis bag #1 contains distilled water immersed in a beaker containing water. Dialysis bag #2 contains 30% sucrose solution immersed in a beaker containing water. Dialysis bag #3 contains 60% sucrose solution immersed in a beaker containing water. Dialysis bag #4 contains 30% sucrose solution immersed in a beaker containing 60% sucrose solution. Dialysis bag #5 contains distilled water immersed in a beaker containing 60% sucrose solution.
Table 2. The change in weight of 5 different dialysis bag solutions over a 40 minute interval
This table compares the change in weight of each dialysis bag at every interval with respect to the different concentration of solution inside the bag and the concentration of fluid surrounding the bag within each beaker. Overall, the change in weight is consistent over each time interval for each trial.
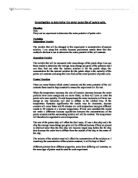
Figure 1. Graph showing the trend of the change in weight of each dialysis bag over each time interval
This graph is a visual representation of the data presented in table 2 showing the change in weight of each dialysis bag over each time interval. As one can see, bag #2 and #3 have a positive slope and bag #1, #4, and #5 have a negative slope. Overall, the change in weight indicates a linear trend.
Table 3. Initial observations showing the difference between isotonic, hypertonic and hypotonic mammalian blood solutions
This table indicates the description of the red blood cells viewed under a microscope, the description of the liquid solution in each flask and the description of the hematocrit in each pipette with respect to the three different types of solutions compared. Overall, all three solutions have a similar colour present in each flask, but different shape in cells when viewed under a compound microscope.
Discussion
Looking at the results from part 1 of the experiment it can be concluded that dialysis bag #1 was isotonic, which means that the fluid surrounding the bag was also isotonic. Dialysis bag #2 and #3 were hypertonic, and the fluid surrounding the bags were hypotonic. Dialysis bag #4 and #5 were hypotonic, and the fluid surrounding the bags were hypertonic. Bag #1 and the fluid it was placed in were both isotonic because the weight of the bag did not change significantly during each time interval. Since the dialysis bag represents the cell membrane, this means that the amount of water molecules moving out of the cell membrane were equal to the amount of water molecules moving into the cell membrane which overall means that the cell has no net movement (Karp, 2010). Both of these solutions were isotonic because the concentration of water inside the bag was the same as the concentration of water outside the bag. Bag #2 and #3 were hypertonic and the fluid surrounding the bags were hypotonic because the weight of the bags increased over each interval. The weight in the bags increased because the water concentration in the flask was greater than the water concentration in the bags. This means that the amount of water molecules entering the bag is greater than the amount of water molecules exiting the bag which overall means that the cell swells (Karp, 2010). On the other hand, bag #4 and #5 were hypotonic and the fluid surrounding the bags was hypertonic because the weight of the bags decreased over each interval. The weight in the bags decreased because the water concentration in the bags was greater than the water concentration in the flask. This means that the amount of water molecules exiting the bag is greater than the amount of water molecules entering the bag which overall means that the cell shrinks (Karp, 2010). Since the dialysis bags are impermeable to solute molecules and permeable to water molecules the change in weight over the entire 40 minute period depended on the relative water concentration between the inside of the bag and outside of the bag for each trial. Looking at the results from part 3 of this experiment it can be concluded that in the hypotonic solution the red blood cells have ruptured and burst because the amount of water molecules that entered the cells exceeded the normal size of the cells ("Osmosis: Background," ). On the other hand, the red blood cells in the hypertonic solution have shrunk, because the amount of water molecules that have exited the cells was more than the normal amount ("Osmosis: Background," ). The red blood cells in the isotonic solution have stayed the same because their is no net movement of water molecules entering or leaving the cells ("Osmosis: Background," ). Looking at the results from part 4 of this experiment it can be concluded that in a hypertonic environment the vacuole in the cell leaf starts to shrink and become plasmolyzed because water molecules are exiting the vacuole during osmosis (Department of Biology, 2011). In a hypotonic environment, the vacuole remains fairly the same size as it would be in an isotonic environment because the cell wall of the leaves prevents the vacuole from rupturing by not letting the vacuole receive extra water (Department of Biology, 2011). In the isotonic environment the vacuole is not to large and not to small because there is no net movement of water entering or exiting the vacuole; instead the vacuole is filled with sap (Department of Biology, 2011). From all three parts of the experiment the effect that an isotonic, hypertonic, and hypotonic solution have on a cells is evident through the observations.
References
Bowen, R. A. (2000). Osmosis. Unpublished manuscript, Department of Biomedical
Sciences, Colorado State University, Fort Collins, Colorado. Retrieved from http://arbl.cvmbs.colostate.edu/hbooks/cmb/cells/pmemb/osmosis.html
Department of Biology. 2011. Introductory Cell Biology Laboratory Manual. University of Waterloo, Waterloo. pp. 43-37.
Karp, G. C. (2010). Cell and molecular biology concepts and experiments. (6 ed., pp. 144-45). Danvers: John Wiley & Sons, Inc.
Osmosis: Background. (n.d.). Retrieved from Osmosis_old/Background1.html