- The pH content of the soil is another factor that will affect the species
diversity since different species can survive in different pH levels. Again, to reduce the effect of that a difference of pH levels may have on the result, the molehills will be chosen so they are close together so they have similar pH levels. However, soil samples will be tested for pH to ensure this.
- The humidity of the air is an uncontrollable variable. It affects the species
diversity because high humidity levels will limit transpiration so certain species will not be able to survive at certain humidity levels.
- Wind speed will also affect the transpiration of plants and so affect the species
diversity. As this cannot be controlled molehills that are out in the open will be chosen so they are subject to the same winds.
- Temperature is a very important and uncontrollable factor. It affects
photosynthesis, transpiration and all other reactions in the organism.
APPARATUS
- Tapered metal rod with one cm intervals marked along the side – this is needed to test for the compaction of the soil so the grade of the molehill can be determined.
- 50x50 cm quadrat with 5x5 cm squares – used to help find species frequency on the molehill.
- Spatula – to take soil samples.
METHOD
- A pilot study will be carried out to determine sample sizes and quadrat sizes
that will be used. This will also be used to determine the sizes of the eight grades of molehill that will be used.
- The determined number of samples will be taken on each eight grades of
molehill and the species frequency will be recorded.
- The species diversity index will be calculated from the average species
frequency of each eight grades of molehills.
RISK ASSESSMENT
Care must be taken when touching unknown plants as they may be poisonous.
Hands must be washed thoroughly after working with plants especially before eating.
Care must be taken when handling the tools, especially scalpels and the metal rods used to test soil compaction.
ETHICAL CONSIDERATION
Care must be taken not to damage any plants or wildlife. This is especially true for flowers since they are the means by which plants disperse their seeds.
Habitats must not be disturbed so the experiment must be carried out discretely.
No litter must be left on the common.
STATISTICAL TEST TO BE USED
Spearman’s Rank Co-efficient – because eight pairs of results will be obtained from this study. Also because the hypothesis suggests a correlation so an appropriate statistical test would have to be a co-efficient.
PILOT STUDY
1. DETERMINE GRADES OF MOLEHILL
In order to do this the compaction of five new molehills and five old molehills was determined. This was done by recording how far a tapered metal rod went down when pushed at arms length.
From these results 30 cm was taken to be the maximum depth of “loose” soil for a new molehill and 0 cm was used as the minimum depth of an old molehill. As eight grades of molehill are required, the range of these values will be calculated and divided by eight. This will give the intervals required between each grade:
Intervals = (30-0)/8 = 8.8 cm
2. DETERMINING QUADRAT SIZE
This was done by counting and recording the number of different species in different sizes of quadrat (5 x 5 cm to 50 x 50 cm):
To find the appropriate quadrat size the average results were plotted in a graph against quadrat area.
Through this graphical representation it was found that 400 cm² (20 x 20cm) quadrat size was the most efficient size to obtain a fair sample.
3. DETERMINING NUMBER OF SAMPLES
Two species were selected to find the species frequency of each in ten 20 x 20cm quadrat samples. The cumulative estimated frequency was then calculated using the equation CEF = (∑xn)/n
The cumulative estimated frequency was plotted against the sample number for both species.
As the graph began to level out at 7, seven samples will be taken at each grade of molehill. This is because this is the lowest number of samples that will give fairly accurate results.
METHOD
Seven grade one molehills were found. Their grade was determined by placing a tapered metal rod on the top of the molehill and then pushing it down at arms length until resistance was felt. The depth that the rod went down was then recorded and the grade determined using the following table established in the pilot study.
A 20 x 20 cm quadrat with sixteen 5 x 5 cm squares was placed on one of the molehills. The species frequency was then calculated by giving each species present in the quadrat a number from 1 to 16, according to how many 5 x 5 cm squares they were present in. The species were identified using a species list that was compiled previously. This was repeated for all seven of the grade one molehills so an accurate overall reading for species diversity could be obtained for each grade.
This method was repeated for the grades of molehill 2 to 8. All the species frequencies were recorded in a results table.
ANALYSIS
RAW RESULTS TABLES
GRADE ONE
GRADE TWO
GRADE THREE
GRADE FOUR
GRADE FIVE
GRADE SIX
GRADE SEVEN
GRADE EIGHT
In order to view and analyse these results more easily a summary table has been constructed showing only the total species frequency of each specie of plant found on the molehills:
SUMMARY TABLE
In order to compare the species diversity on the different grades of molehill the species diversity index was calculated for each grade using the following formula:
N x (N-1)
n1 x (n1 – 1) + n2 x (n2 – 1) + n3 x (n3 – 1) + etc.
Where:
N = total species frequency
n1 = species frequency of species 1
n2 = species frequency of species 2
n3 = species frequency of species 3
etc.
The species diversity index is used because it gives an accurate description of the species diversity since it takes into account both the number of different species and the abundance of each species.
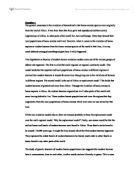
The table shows a general increase in species diversity index as the grade increases. This means that the species diversity on a molehill will increase the older the molehill gets. From the table it is obvious that the calculated SDI for grade 7 molehills is an anomalous result since it does not follow the trend and is less than the SDI for grade 5 and 6 molehills. Although the SDI shows a general increase with the age of the molehills the total species frequency does not show the same trend as expected. This can be seen on the table in the row labelled N, and there is no clear pattern to be seen as the molehills get older. This can be seen on the graph below:
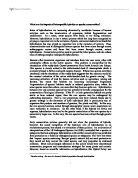
This graph shows only a weak positive gradient which cannot be considered substantial evidence for a relationship between the total species frequency and the age of the molehill because the points are positioned so randomly. However, by looking at the following graph we can see the trend of the SDI values more easily:
As can be seen there is a steady increase in SDI as the molehills get older. However, there are two anomalies which have been highlighted. The first is the SDI value of zero for the grade one molehills which is far below the line of best fit (LOBF). The grade 7 value of 7.21 is also anomalous because it is lower than the SDI values of both grade 5 and 6 molehills. It dips below its theoretic value which the LOBF passes through. Grade 7 is the only grade of molehill with a lower species diversity index than the grades of molehill that are younger.
SPEARMAN’S RANK CO-EFFICIENT
This is the inferential statistics test that will be used to test the significance of the results. The two sets of data that will be used are:
1. Grade of molehill – which represents the compaction of the soil.
2. Species diversity index.
The formula to calculate the spearman’s rank is:
6∑d²
Rs = 1- n x (n² - 1)
The calculated rs value is +0.93. As there are eight grades of molehill n=8 in this experiment. 0.643 is the critical value when n=8 at the 5% p-level. Since the calculated rs value is greater than the critical value the results of this study are significant at the 5% p-level. This means that there is a less than 1 in 20 percent probability that the results obtained are due to chance. This means that the null hypothesis is rejected because the original hypothesis and predictions are accepted:
Hypothesis
The compactness of the soil of the molehill will alter with the age of the molehill.
The age of the molehill will affect the species diversity of plants growing on it.
Prediction
The compactness of the soil on the old molehills will be greater than the compactness of the soil of the newer molehills.
The older the molehill the greater the species diversity index it will have.
Since the critical value at the 1% significance level is 0.765 and the calculated rs is greater than this critical value, these results are significant at the 1% significance level meaning that there is less than a 1 in 100 chance that these results are down to chance.
DISCUSSION
These results show a significant positive correlation between the calculated SDI values and the grade of molehill. The grade of molehill is directly linked to the compaction of the soil of the molehill. The youngest molehills have very loose soil because it has just been pushed up from underground by the moles clearing the excess soil from the underground tunnel systems. Over time the soil compacted so the age of the molehill can be determined by measuring the compaction of the soil. In this study grade 1 molehills were the youngest and grade 8 were the oldest. The positive correlation shows that the older the molehill the higher the species diversity index.
This could be explained by the fact that when the moles first push up the soil it disturbs the plants growing on the surface and many of these plants are buried under the loose soil. There are three ways in which the plants may be able to re-establish themselves:
- Firstly the plants that were buried during the formation of the molehill may push up through the loose soil and re-establish themselves.
- Dormant seeds may germinate or new seeds, probably wind-dispersed seeds, may arrive. The soil pushed up from underground is usually warmer, dryer and better oxygenated than the top soil. These would be perfect conditions for this to occur.
- The final way is for surrounding plants with creeping habits to infiltrate onto the molehill.
All of this, however, is takes time and the more time they have the more species and individual organisms will be able to establish themselves. This means that in theory the older the molehill the greater species diversity it will have growing on it which supports the findings from this experiment. This means that the experimental hypothesis was correct.
There are two anomalous results highlighted on the graph plotting SDI against grade of molehill. The first is the SDI value for the grade 1 molehills which is 0. This, however, is not due to any environmental factors but simply because the Simpson’s index formula used meant that if all the species had a frequency of one then the SDI would be N x (N-1)/0. This is not an accurate SDI value so the formula is flawed. The second anomalous result was the SDI value for the grade 7 molehills which is a lot lower than the line of best fit on the graph. This could be for many reasons, one of which is that measuring the compaction of the soil is not the most accurate method of determining the age of the molehill so the molehills used may not have been the age that was thought.
Another finding of this experiment was that there was only a very weak correlation between the total species frequency and the age of the molehill. This could be explained by the fact that species frequency does not count the number of individual organisms so there may have been a large number of individual organisms densely packed into one square and would only be valued at one, while a single stray organism would still get the same value if it were the only one in the quadrat.