4.3 Social Factors:
Changes in the demographic, trends in the way people live, think and work and the cultural aspects of the macro-environment are all social or socio-cultural factors which need to be considered. These factors affect the needs of the customer and the potential size of markets.
As the trend for holiday homes abroad increases, with people on average taking more holidays per year than before, the low-cost airlines continue to grow at a phenomenal rate. More consumers who are moving towards retirement age are buying homes abroad. And with the financial ability to set up a second home abroad, they are able to take more trips via airlines. With statistics showing annual holidays are becoming more frequent for British consumers; airlines are building up a new passenger market. With the economic state in the current recessive condition, those who continue to take holidays will look for value, and airlines who offer package deals at a budget are benefiting. (Anon, 2005)
With the introduction of low-fare airlines, consumer behaviour is changing. The airline industry found consumers who previously travelled by trains, were choosing to fly, due to the low prices on offer from airlines. This change in consumer behaviour patterns is due to price drops and increases in competition and choice. (Swarbrooke & Homer, 2007)
The distribution of income and the changes in the disposable income has a counteracting effect on the aviation industry. With recession, the income distribution will surely have a negative effect on the aviation industry. With consumers with higher income brackets continuing with the privilege of flying, leaving those with lower income brackets opting for cheaper alternatives.
With the responsibility of flying millions of passengers worldwide every year, airlines also have a duty to take precautions in the interests of passenger safety. There are many areas in which the aviation industry has to tackle safety issues. Bad weather conditions such as lightning, ice and snow are all major threats to flights and aircrafts have been designed with non-conducting materials to withstand such conditions. Heavy snow or ice on runways can make braking and steering extremely difficult or impossible, to prevent any danger from occurring; the only route is to monitor weather conditions. Engine failure, stalling of aircrafts and fire are all issues which are difficult to predetermine, however tests and regulations have been implemented in order to be as prepared as possible. (IATA, 2009)
Human error is one issue which cannot be foreseen, and in order to minimise risk checklists have been introduced to ensure all aspects of a flight are considered. Terrorism can also be categorised as human error and since the 9/11 attacks, stricter airport security measures have been introduced to prevent this. (Metric Stream, 2009)
4.4 Technological Factors:
Technological factors are vital in order for companies to have a competitive advantage, be efficient and have a major drive for change. These factors can lower barriers for entry into an industry and influence production and outsourcing decisions. The revolution of technology has had a profound effect on the global community.
The internet has allowed the aviation industry to excel and grow continuously. Alongside online ticket booking, airlines have introduced paperless tickets. By eliminating paper administration, flying has become a more simple and easier to use process. The use of the internet has also influenced consumer behaviour. With the simplicity of online ticket booking, airlines are increasing revenue and custom, using modest incentives to promote online booking. (Ottawa Group, 2009)
As part of the IATA’s Simplifying the Business Programme, e-tickets, self-service check-ins, bar-coded board passes and e-freight were amongst the key projects to technologically enhance the aviation industry. (Financial Express, 2009) With this new project, airlines are able to have huge cost savings, which in turn will benefit the consumer, by way of cheaper ticket prices. Electronic administration means airlines save on ticket distribution, as well as paper savings. This also eliminates risks of counterfeit, loss and damage. Online self-service check-ins has also simplified the flying process for airlines and passengers, removing the queuing process and any additional problems. (Telegraph, 2009)
The use of mobiles on aircrafts has been banned for many years, due to the risks involved and effects on the navigation equipment being highly unstable. However recently there have been plans to allow the use of mobiles on aircrafts, with an on-board base station using the passengers’ own networks. However there are currently many restrictions, with handsets only allowed on after the aircrafts reach a certain height. (3g, 2009)
In order to coincide with a greener global community, airlines are adopting newer aircraft which are more improved for efficiency, with less noise pollution and fuel usage. In order to improve fuel conservation, the IATA issued a checklist on fuel and emissions to member airlines in 2005. These guidelines were introduced to assist airlines to be more eco-friendly. (New Airplane, 2009)
- The Financial Appraisal – Chosen Ratios
In order to determine the strengths and weaknesses of the companies chosen, an in-depth ratio analysis will be undertaken in this report. The use of ratios is an ideal way to evaluate a company to get a valuable understanding of its performance.
5.1 Liquidity Ratios:
Liquidity ratios help to establish how quickly a company can generate cash to settle its debts in the short term. For the survival of a company, a practical level of liquidity is paramount.
Current Ratio = Current Assets/Current Liabilities
This ratio will compare the ability to cover short-term liabilities with short-term assets. The higher the ratio, the more liquid a company is, which is more preferred. (ACCA, 2009)
5.2 Efficiency Ratios:
This ratio is used to measure the efficiency on the use of a company’s resources and liabilities. To ensure that resources are well managed and utilised, efficiency ratios allow for improvements to increase profitability and cash flows.
Asset Turnover Ratio = Sales Revenue/ (Fixed Assets + Current Assets)
This ratio will measure how many sales (£) the companies generate from £1 of the assets they have employed. The higher the turnover, the better the companies are performing. (Tutor 2u, 2009)
5.3 Profitability Ratios:
This ratio shows a relative measure of profit, and is used to assess a company’s ability to generate earnings, in comparison to the expenses and other costs, which are incurred during the accounting period.
Net Profit Margin = (Net Profit x 100) /Sales Revenue
Net profit is the profit after all the expenses have been taken into account; this represents what percentage of sales revenue is net profit.
Return on Capital Employed = Net Profit (Operating Profit) x 100
(ROCE) Capital Employed
This ratio measures the profits of a company in comparison to the initial capital employed. In an attempt to see how effectively a company uses its capital, ROCE helps to maximise the return on the capital employed. (Tutor 2u, 2009)
5.4 Solvency Ratios:
This is used to assess how well a company can meet its short and long-term obligations, thus its financial soundness.
Gearing Ratio = Total Liabilities/Shareholders Equity
Also known as the Debt/Equity Ratio, it measures what proportion of the company’s assets is financed by borrowing. Theoretically, high gearing is potentially risky. (Tutor 2u, 2009)
5.5 Investment Ratios:
In order to assess the performance of a company from an investor’s point of view, the earnings of the investments must be measured using Investment Ratios.
Earnings per Share (EPS) = Net Income – Dividends on preferred stock
Average Outstanding Shares
This ratio is used to measure the overall profit generated for every share in issue, over the accounting period. EPS is an indicator of the company’s profitability. (Tutor 2u, 2009)
Price/Earnings Ratio (P/E) = Market Price of Share/EPS
This ratio is a valuation of the company’s current share price in comparison to the EPS. It is used as an indication of how highly a company is rated in the industry by the market. (, 04/01/09)
5.6 Aviation Industry Specific Ratios:
These ratios will be used to measure the performance of the companies, by taking into consideration the factors which only affect the aviation industry. Unlike other accounting ratios, these ratios will enable one to understand the performance of airlines in relation to their services and consumers.
Available Seat Miles = Total No. of Seats Available for Transporting Passengers
(ASM) x No. of Miles Flown during Period
This ratio calculates the number of seats available for purchase on a plane, and by distinguishing how many seats have been purchased, the airline’s overall operating capacity for transporting passengers can be established. By measuring the total output of an airline, the ratio represents the total cost of a unit of output in passenger service.
Revenue Passenger Mile = No. of Revenue Paying Passengers x
(RPM) No. of Miles Flown During Period
This ratio indicates how many seats are actually sold on an airline’s flight, thus measures revenue based on airline traffic.
Load Factor
This ratio relates the two previous ratios together and is the main ratio used in the aviation industry, calculating the percentage of seats that must be occupied by paying passengers, for the revenues from operations to cover the costs. Measuring an airline’s carrying capacity, it concentrates on the utilisation of their assets. As airlines frequently have high fixed costs and are capital intensive, the efficiency with which assets are used is crucial. (O’Connor, 2001)
Along with the ratios which have been chosen, the following will be used in order to enable the analysis of the companies to be more comprehensive:
Quick/Acid Test Ratio = Current Assets less Stock/Current Liabilities
This is a stricter test, eliminating the stock element as many companies cannot readily convert stock into cash. This ratio will be used in addition to the Current Ratio as it is takes into consideration liquidity with respect to inventory.
Dividend Yield = Annual Dividends per Share
Price per Share
This ratio shows how much a company pays out in dividends every year in relation to the share price. A measurement of how much cash flow is received for every pound invested in equity. (Investopedia, 2009)
A range of ratios have been chosen to analyse the performance of the selected companies in the final report. Each ratio will measure different aspects of each company so that the strengths and weaknesses can be identified, hence establishing the reasons behind the success and failures of companies in the aviation industry.
- The Financial Appraisal
- Ratio Analysis
When looking to consider the performance of the chosen companies, a detailed analysis of the ratios is required. This will help to identify the areas where companies are performing well, and the areas which need to be looked into in order to determine the financial strengths and weaknesses of each company. (Appendix 8.1.1 – 8.1.6)
Liquidity Ratios: - Current Ratio:
The current ratio for BA, spanning five years from 2004 to 2008 shows the company’s relatively consistent ability to cover its liabilities. Ideally the current ratio should be above 1, as this indicates that there are more than enough current assets to fully cover any current liabilities suffered by the company. BA however has only exceeded 1 once in 2006, but this figure has slightly dipped over the last two years. But by remaining slightly less than 1 means that overall BA is able to meet its debt obligations.
Flybe on the other hand has not been as consistent with meeting its short-term obligations. Falling to its lowest over the five years to 0.75 in 2006, the current ratio improved in 2007, but again dipped to 0.91 in 2008. This could imply that the company is struggling to keep enough current assets to meet its current liability obligations. When comparing Ryanair and easyJet, it can be ascertained that there has been a gradual decrease in the current ratio for meeting liability obligations. In 2004, both companies were able to meet their obligations twice over, with current ratios exceeding 2. But by 2008, both the companies’ current ratio has decreased substantially. Considering this change, both companies may have made changes to the way they held current assets, by utilising their current assets more, but it may also be that the current liabilities have increased.
The current ratio for Virgin shows that over the past five years, the company has been able to meet its current obligations, with more current assets available to do so in recent years. But in 2008, the ratio fell slightly, and this may be an indication that current liabilities have increased.
When considering all five companies together, it can be said that although BA has been consistent, and Virgin’s current ratio has progressively increased, easyJet and Ryanair are performing better overall with higher current ratios than the other companies. A higher current ratio indicates more liquidity for the companies. The industry current ratio is 1.09, and when comparing this to the five companies, BA and Flybe are slightly underperforming at just less than 1, however the other three companies are exceeding this, which suggests that they are performing well. As a cash intensive industry, the aviation industry should be high in terms of assets, and therefore be able to meet its debt obligations, and this can be seen when comparing the companies with the industry as a whole.
Quick / Acid Test Ratio:
Using this ratio means considering the companies’ ability to meet their short-term liabilities by eliminating stock, that cannot always be readily converted into cash. By eliminating the stock element, the current assets of the companies will be slightly lower, thus the trends followed by the current ratio are mirrored by the quick ratio. Therefore this ratio shows that easyJet and Ryanair are still able to meet their liability obligations better than the other companies. This gives a clearer indication of the companies’ liquidity positions. The quick ratio for the industry currently stands at 0.79, and when considering this, all the companies have effectively utilised their current assets to meet their current liabilities as their ratios are above the industry average.
Efficiency Ratios - Asset Turnover Ratio:
The performances of all five companies are at different levels in terms of asset turnover. Aside from easyJet which has slightly decreased over the last five years, the other companies to some extent have increased their asset turnover ratios. easyJet has been reasonably consistent, but with turnover not matching the assets held and accumulated over the last five years, the ratio has been at its lowest of 0.76 in 2007.
Flybe and Virgin on the other hand has been effectively employing assets in order to increase turnover, as a steady increase over the past five years has shown their asset turnovers to more than exceed the assets acquired. Virgin has had the more progressive increase in asset turnover from 1.15 in 2004, increasing to 1.48 in 2008. But the asset turnover for Flybe fell in 2007 to 0.96, and this may have been due to an excessive increase in aircraft purchase, but this fall picked up tremendously in 2008, reaching 1.60.
Although BA and Ryanair have shown an increase in their asset turnover ratios over the last five years, the underperformance indicates that the two companies are struggling to generate the turnover required in order to effectively utilise the assets employed. When looking at all five companies collectively it can be seen that Flybe has the highest asset turnover ratio, followed closely by Virgin. But with a more consistent growth in asset turnover, Virgin is employing assets which are generating higher revenues, whereas Flybe, although has a high asset turnover ratio, has been fluctuating through out the five year period. The asset turnover for the industry is 0.80, and when taking this in to account, all the companies are exceeding the expected turnover, however Ryanair is lagging behind. This result goes against the concept of a budget airline, which should have a high asset turnover as revenue is generated quickly.
Profitability Ratios - Net Profit Margin:
Ryanair and easyJet had a continuous increase in their net profit margins from 2004 to 2007, with the profit margin for Ryanair being much higher than easyJet. But in 2008, the net profit margins for both companies fell drastically; this could be for a number of reasons such as the affects of the ‘Credit Crunch’. Virgin however has not been consistent, with very low profit margins, its highest was in 2006 reaching to 4.12%, and in 2008 it fell further to 0.82%. This is not a very promising profit margin as it indicates that there is a lack of cost control. The only company out of the chosen five which has been continually consistent is BA, progressively rising from 1.72% in 2004 to 7.79% in 2008. But the company whose profit margin has seen numerous fluctuations is Flybe, with negative profit margins in 2006 and 2007, it recovered in 2008, increasing by 12%, this may have been due to the effects of the looming recession causing customers to choose cheaper travel options.
Taking all five companies into account it can be seen that although in 2008, the profit margin fell by almost 5%, Ryanair has the highest net profit margin, and this could be due to high revenues and low expenditures. Looking at Flybe over five years it has struggled the most in terms of net profit margins, but considering the 2008 figures, it is performing better than Virgin, whose net profit margin is under 1%. With an industry ratio of -10.61%, the industry as a whole is suffering, but considering the companies which have been chosen, although Flybe had negative net profit margin for 2006 and 2007, its recovery meant that all the companies were performing above the industry as a whole.
However when considering the net profit margin, the asset turnover ratio must also be considered, as the secondary ratios to the ROCE, a high profit margin will generally mean that sales prices are high, which will consequently depress the revenue, and so lower the asset turnover of a company. With a high asset turnover a company must generate a high volume of sales, and in order to do this, prices must be kept low. Therefore this type of high asset turnover will be expected from the low-cost airlines, whereas the high profit margin will be the resultant of high profit margins of the international long-haul airlines. However the opposite is seen, with Ryanair showing a high net profit margin and low asset turnover, and Virgin showing high asset turnover and low net profit margin.
ROCE:
This ratio combines profitability and asset utilisation of airlines, and is the most important profitability ratio. Ryanair, easyJet and Virgin have all seen the ROCE go up and down in the past five years. With Ryanair staying relatively constant in the 10% range, it fell in 2008 to 8.25%, easyJet also saw a fall from 10.65% in 2007 to a more drastic 4.92% in 2008. These two companies may have suffered this decrease for a number of reasons, and one may be due to the increased competition from airlines such as Flybe, who experienced negative ROCE in 2006 and 2007, but increased considerably by 2008 to 21.10%. This may be due to the purchase of new assets (aircraft), which may reduce ROCE at first. When looking at the two Atlantic companies BA and Virgin, it can be ascertained that BA has seen a gradual increase in ROCE from 2.52% to 11.21% over the last five years, however Virgin has struggled with its highest ROCE being 10.68% in 2006, and it has been reduced to 0.98% by 2008. Therefore it could be said that when using capital to generate profit, it is not working as efficiently as the other companies.
Therefore by considering all five companies together, it can be seen that in 2008 Flybe performed the best in terms of using its capital effectively in order to maximise the return on the capital employed. On the other hand Virgin has struggled to utilise its capital effectively. There can be various reasons for such trends occurring for the companies, and increased price-cut competition can prove very detrimental to companies such as Virgin, who as a global company will have greater expenditures and capital. Overall Ryanair proved to be the most profitable in terms of the highest ROCE over the five year period.
Stability Ratios - Gearing Ratio:
In an attempt to ascertain how a company is financed, it is important to look at the gearing ratio, which considers which proportion of the company is financed by debt and by equity. High gearing is potentially risky due to too much debt finance causing uncertainty within the company, as debt obligations must be met regardless of the company’s financial position. Looking at the chosen companies, it is apparent that there are substantial differences in the way each company funds its operations. When looking at this ratio, it can be said that due to a stable revenue stream, the aviation industry may be able to finance a higher proportion of debt compared with other sectors.
Virgin and BA have both had decreasing gearing ratios over the years, which is a good sign, showing that the companies are reducing their finances in terms of debt, consequently increasing their equity finances. On the other hand Ryanair and easyJet have both been gradually increasing in terms of debt to equity, however their gearing is relatively low, and therefore the balance of finance between debt and equity is of comparatively low risk. But Flybe however has very high gearing of 24.55 in 2008, and considering the risks attached, can prove very detrimental to the company. Although the gearing has fluctuated for Flybe through the years, the current year’s gearing shows the company’s current situation of being financed with a relatively high amount of debt.
When comparing all five companies, high gearing can cause Flybe to be more susceptible to funding problems, with more debt finances meaning that more cash will be tied up in paying for these debt obligations. With the recession causing a decrease in customer numbers, the other four companies will be more able to contend with the deflation as less of their finances are debt obligations. This can also be seen when considering the industry gearing ratio of 6.80, which is exceeded by Flybe. However Flybe is a relatively new company, originally British European, it re-emerged in 2002 with a new name and repositioned itself as a full service, low-fare airline, this may therefore be the reason behind Flybe’s high gearing.
Investment Ratios - EPS:
Due to the differences in nominal values of shares of different companies, it is not very useful to compare the EPS of one company to another. However in terms of monitoring the changes over a period of time, it enables the performances of the companies to be examined.
Looking at all the companies together, it is apparent that although there have been ups and downs, generally the EPS of BA, Flybe and Ryanair have increased. All three companies suffered at some point during 2006 and 2007. But Virgin on the other hand has found the changes in EPS to be most volatile. With the highest EPS being 14.59p in 2006, the other years it has remained around 3.00p. For the first four years, easyJet saw a gradual increase in EPS; however in 2008 this fell slightly to 22.10p. Therefore comparing all the companies shows that apart from Virgin, the other companies are increasingly growing in profit performances. However it must also be considered that whilst some companies may have increased the number of shares issued, others may have reduced the shares or remained constant.
Price/Earnings Ratio:
Considering that the P/E ratio allows investors to interpret the valuations of each share in comparison to the net income received, it can be said that a high P/E ratio indicates that one share of a company is more expensive than that of a company with a low P/E ratio, consequently showing a current investor’s demand of a company share.
When looking at the chosen companies, volatilities in the ratio can be seen, however when considering the two long-haul airlines BA and Virgin, it can be seen that overall Virgin has a higher ratio than BA. The P/E ratio of BA has been following a unstable trend of decline from 2004 to 2008, whilst Virgin has remained relatively stable in the region of 20, aside from fluctuations experienced in 2004 and 2006, spanning from 204.08 to 6.85 respectively.
When looking at the budget airlines it can be seen that the P/E ratios for all three companies have been much lower. Although all three companies have been showing declining trends, Flybe has suffered the most with ratios falling to negative figures in 2006 and 2007. Ryanair and easyJet on the other hand have been able to stay in the region of 10 – 20, however have fallen behind Virgin who overall has had the most consistently high P/E ratio, as one of the larger and more established companies, Virgin’s performance in terms of P/E shows that it is performing well. But like Virgin, BA has not followed the pattern; instead Ryanair is leading BA with a higher cumulative P/E. Therefore in general all five companies have shown that there is a demand for the company shares to some degree.
Dividend Yield:
When looking at the dividend yield for the five chosen companies, it can be seen that all five companies have not been paying out dividends throughout the last five years; however for BA the dividend yield in 2004 was 2.10%, but the subsequent years showed no dividend payout. However this does not mean that the companies were not operating effectively. One reason for not paying out dividends may be due to the companies reinvesting their funds instead of making dividend payments; this subsequently enables a company to increase their market value by undertaking new projects, purchasing new assets and acquiring new companies. Although paying dividends gives the investor a stream of income, it is unstable in terms of fluctuating dividend distribution from year to year. This can adversely affect the price of a security in the company. Therefore by eliminating dividends, all five companies are able to invest in other areas.
Industry Specific Ratios
Ratios which are related only to the aviation industry must all be looked at together. Looking at the Available Seat Miles and Revenue Passenger Miles, the operating capacity of the airlines can be distinguished by considering the number of seats available for purchase, this is then further analysed by considering the number of seats which are actually occupied by revenue paying passengers. Expressing these ratios as percentages makes comparisons between the airlines more appropriate, due to the differences in the sizes of the companies.
Looking at the overall performance in relation to the airlines’ capacity, BA has been consistent throughout with ASM lying between 74.43% and 76.70%, this has continued with RPM, although it was 66.48% in 2004, from 2005 onwards it has been relatively stabilised to stay in the region of 55%, showing customer loyalty. So comparing the RPM and ASM in terms of the load factor, it can be seen that of the available seats around 75% of the seats have been purchased, with consistency over the years. The same trend has been followed by easyJet, with the ratios remaining constant over the last five years, the load factor for easyJet however showing that there are more revenue paying passengers for the amount of available seats. Ryanair on the other hand, although has similar ASM and RPM to the other two companies, has a load factor which has been decreasing over the last four years, but is still relatively high at 80.63%.
But unlike the consistency experienced by the other companies, Virgin and Flybe have seen unstable results. With decreasing ASM and unpredictable RPM ratios, the load factor for Flybe has seen a gradual increase to 68.32% in 2008. Virgin however has had irregular load factors throughout the last five years.
The load factor can be used as an important measure of efficiency, but it does not take into consideration the pricing and profitability at which the capacity is sold. It also assumes that the airlines’ are fully utilising their aircraft in terms of kilometres flown.
Taking all this in to consideration it can be said that some companies have suffered due to falling customer demands, whilst other have benefited from this in respect of cheaper travel. The companies which have performed well in comparison to the others are easyJet and Ryanair, both low cost carriers, with Flybe seeing an increase in its load factor, whereas Virgin has experienced instability.
Ratios are a useful tool, if used in the correct context; they provide information on a company’s overall economic situation, giving values which are easier to interpret than that of financial statements alone. They facilitate the understanding of how certain variables could influence each other, helping to determine a range of financial aspects. By studying the relationships of various financial factors in a company, a trend can enable a detailed analysis to be prepared.
However there are disadvantages to this method if not used correctly, with limited comparability, there is an inability to correctly analyse the relevance of a ratio. Companies within different industries apply different accounting policies, which can therefore lead to distortions to the analysis. Some industries, such as the aviation industry, may be highly cash generating, which would require the analysis to be interpreted with regard to this additional information. When considering the limitations, some scepticism must be applied to using ratios. With the use of historical data and qualitative data ignored, the results obtained can be misleading. A single ratio can not provide a complete picture of performance, and factors such as cost and inflation can distort the information collected. (Universal Teacher 4u, 2009)
Therefore other measures must also be considered in order to get a detailed understanding of the performance of the chosen companies.
- Determining the Best and Worst Company
To enable one to determine the performances of the chosen companies, which will in turn allow for establishing the best and worst company, the current state of the aviation industry and UK economy as a whole must be considered and analysed.
With the problems of sub-prime mortgages in the US causing a global credit crisis in August 2007, recession filtering into the UK economy was ominous. In January 2009, after months of speculation, recession was finally confirmed when statistics showed a decline in GDP, showing negative growth in the UK for two consecutive quarters. (BBC, 2009)
This ongoing decline in the economy has put many sectors under financial strain, and this has had a knock on effect on other sectors, one being the aviation industry. This reduction in income has meant that consumer spending has also followed suit, which is proving to be extremely damaging to businesses. With a fall in the number of passengers by 8% in December 2008 from 2007, many airlines have been grounded and routes cut as they struggle with the decreasing passenger numbers. (Telegraph, 2009)
A fall in passengers has for many airlines led to drastic cuts in an attempt to save costs wherever possible, as revenues continue to go down, with more than 30 airlines already going bankrupt as a result of the recession in the past 12 months. (Business Week, 2009)
After considering the economy as a whole and how the UK’s recent entry into a recessionary climate has affected the aviation industry, the position of the chosen companies in respect of this must also be considered. When looking at the ratio analysis conducted for the companies, they were looked at in terms of their individual performance, but to determine the performances of the companies in unison, a ratio comparison of all five companies can be done. (Appendix 8.2)
When looking at the liquidity ratios, it can be seen that where Ryanair is excelling, by employing current assets effectively so as to cover the current liabilities, British Airways is not doing as well as the other companies, scoring the lowest in terms of liquidity. However when looking at the efficiency ratios Ryanair is the worst performing in terms of asset turnover, with Flybe generating the most in terms of the assets it has employed. There could be many reasons for this, where Ryanair may have an extensive range of fleets, which were not fully utilised, Flybe may have a small fleet, which were utilised fully.
When looking at the profitability ratios of all five companies it can be seen that Ryanair is again scoring the highest, with high net profit margin and ROCE, its performing exceptionally well in terms of the revenue generated and the effective use of the capital employed. But Virgin however is performing the worst in terms of profitability over the last five years. The reason for this maybe because of the low-cost carrier hype, with many customers now choosing to fly with budget airlines as recession continues to affect both consumers and businesses. Since the economic downturn, many airlines such as Qatar Airways have had to reduce the number of business flights as passengers are opting for economy seats instead. (RTE Business, 2009)
Considering the solvency of the chosen companies, it can be said that Flybe is at the most risky position in terms of gearing. With much higher debt to equity ratios in comparison to the other companies, it has been struggling with finances throughout the last five years; on the other hand easyJet has been the most effective, with the lowest gearing throughout the last five years. This gearing issue can be seen in its EPS ratio, with Flybe having a very low EPS throughout the last five years, along with Virgin. Amid plans to float their shares on the stock market, Flybe’s poor performance on gearing is risky and can be very unattractive to potential shareholders. However as BA is the UK’s largest long-haul carrier, it has performed the best in terms of its consistency by having very high EPS over the last five years, whereas Ryanair and easyJet, have both been performing equally as well as each other.
When looking at the aviation industry specific ratios, it can be therefore seen that, in terms of passengers flown and revenue generated, easyJet has performed extremely well, followed closely by Ryanair, efficiently using the seats available and generating revenue paying passengers to fill them. However Flybe has performed the worst out of the five companies.
When looking at all the ratios together, it can be seen that overall easyJet is performing most productively with Ryanair being second out of the five companies. The reason for easyJet performing better than the two long-haul carriers BA and Virgin maybe due to the cost savings which are experienced by customers when flying with the low-cost airlines easyJet and Ryanair. Flybe however is performing the worst, and this could be due to the fact that they are struggling to compete with the two large low-cost carriers’ easyJet and Ryanair, whether this is in terms of competing with prices, or other costs associated with the airline.
But using ratios alone to determine the success or failures of a company does not provide users with enough relevant information. Further analysis is required into the non-financial aspects of a company, considering the internal and external factors which could affect it. By using a SWOT analysis, these additional factors relating to the individual companies can be explored. A SWOT analysis is a planning method which is implemented when consideration is required about a proposed project or business venture. It enables the users to evaluate the Strengths, Weaknesses, Opportunities and Threats related to a specific objective. It enables the identification of the internal and external factors which may be favourable or unfavourable in order to achieve the set objective. (Tutor 2u, 2009) In order to determine the strongest and weakest company, a SWOT analysis for each individual company has been compiled (Appendix 8.3.1 – 8.3.5)
The aviation industry is global in its day to day dealings, and even with the recession becoming an international crisis, there are numerous strengths which the companies in the industry possess. BA and Virgin are the two largest international scheduled airlines operating from the UK. With years of aviation experience, both the long-haul carriers are better equipped in terms of exceptional customer service experience. Both airlines also provide Club house experiences with fully flat beds in their first class cabin, and through code sharing, where one airline puts its identification code on the flights of another airline and operates them on their behalf, and airline alliances they are able to provide an extensive range of destinations to fly to.
The low cost-carriers on the other hand have the advantage of low costs, through ‘virtual’ administration, from online tickets to check-ins; they are able to pass these low cost benefits on to their customers through very competitive flight prices. In this respect, the long-haul airlines have the advantage of being the largest international scheduled airlines; however the low-cost carriers easyJet and Ryanair are the largest budget airlines, who in the recession will benefit from being able to provide low-cost services.
The weaknesses of the companies help to determine the problems which are being faced, especially considering the current economic climate. The main issue faced by the long-haul carriers BA and Virgin is the increased competition from the low-cost airlines, where easyJet, Ryanair and Flybe are able to provide low-cost package holidays; BA and Virgin may be unable to cut their costs as low as the budget airlines, hence losing potential customers to the budget competition. As the better established airlines, BA and Virgin are better facilitated to be able to survive the recessionary period, with stable relations with customers and suppliers. Low-cost airlines such as Flybe, who are the more newly established airlines, could also face difficulties in maintaining low prices in times of recession as costs are initially high for new companies. The low-cost carriers are also faced with the fact that they do not provide transatlantic services, and unable to provide such a service means that customers that seek to fly internationally will not be able to use their services.
But considering the opportunities which are available to the companies, the three low-cost carriers Ryanair, easyJet and Flybe can all branch out into the low-cost transatlantic market, which has not been explored yet. In doing so, during the recession the low-cost carriers will be able to provide a low-cost service to compete with the long-haul carriers. BA and Virgin also have many opportunities to contend with as the UK slips further into recession, by looking to open hubs in foreign markets, they are well established enough to be able to capture the markets where other airlines maybe suffering. However this will be a long term goal in order to be beneficial.
Looking at the external threats which are being faced, all of the companies are facing many of the same threats. With high fuel prices and terrorism alerts being substantially high, all the airlines are required to increase and maintain high levels of security, as this is a potentially disastrous area if not dealt with effectively. This was seen with the occurrence of the 9/11 attacks, passenger numbers fell drastically, and consequently took nearly three years to peak back to the levels prior to the incident. (Bureau of Transportation Statistics, 2009) Recession is also another factor which all the airlines are faced with, as people search for alternatives in order to reduce out goings, the industry as a whole has been suffering, but mainly the two long-haul carriers BA and virgin will be affected as the budget airlines ‘steal’ many of their passengers.
When considering the SWOT analysis of all five companies, it can be said that the companies performing well and are likely to do in the near future are the budget airlines easyJet and Ryanair, Flybe is also following close behind, as these companies are able to provide cut prices in times of financial depression. The international carriers however seem to be in a compromising position and only by following the price-cuts of the budget airlines can withstand the recessionary period.
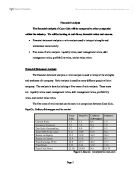
In addition to the SWOT analysis, the trends in sales growth and profitability can also aide in determining the successes of the chosen companies. Where the SWOT analysis looked at the non-financial factors and the ratio analysis looked into the financial factors, considering the trends in sales growth helps to give an idea of the size of each company in comparison to its competitors.
Source: Global Business Browser (2009)
Source: Global Business Browser (2009)
When looking at the above tables, it can be ascertained that all five companies have seen a steady increase in sales revenue over the last five years; however the revenue of BA is almost four times the revenue of easyJet, Ryanair and Virgin. Although Flybe has seen a steady increase its revenue is substantially lower than that of the other four companies. This pattern of sales growth shows that BA has the highest turnover of all five companies, with its profit after tax showing the same result.
If the percentage growth from 2004 to 2008 is considered, it can be seen, that although BA has the highest turnover, it is in fact Ryanair whose turnover has increased the most in terms of growth by 156.26%, with BA having the lowest growth at only 15.78%. This may be due to the introduction of the low-cost carrier, which led to many customers choosing the budget airlines. When looking at the growth of profitability, it can be seen that the two long-haul airlines BA and Virgin have been the most profitable due to the fact that they are well established companies, thus costs are likely to be low. Flybe however has the highest profitability growth, and this may be because of the introduction of paperless administration.
By considering all the analysis which has taken place, a conclusion can be made as to determining which company is performing the best and worst. In this case, it can be ascertained that easyJet is the best company, whereas Flybe is struggling in terms of its competition, with two successive years of negative growth, it is now performing better.
- Conclusion
The aviation industry has become an international sector over the years, providing a basis for many other sectors to connect on a global scale. However with the current financial condition of the global economy, the industry is looking to face increasingly turbulent times. With the number of premium passengers falling by 17% in January 2009 in comparison to last year and cargo traffic falling by 23%, the aviation industry is deteriorating much more rapidly than could have been anticipated. (Financial Times, 2009)
All the companies which have been analysed have all been affected by many factors, both internal and external, and some financial and non-financial. British Airways is the UK’s largest international scheduled airline, but with the current economic climate it has seen the number of revenue paying passengers fall, and alongside this so has Virgin. Although they both have years of experience and large brand names, the introduction of low-cost carriers has meant that the original format had to be changed for both companies in order to compete with the likes of easyJet and Ryanair.
Ryanair and easyJet both found a niche in the market with the low-cost airline concept, and this has proved to be extremely successful. As the two largest low-cost carriers in Europe, they have been able to compete with the international airlines BA and Virgin. With the package holiday offers and low administration costs from their side, the budget airlines were able to provide extremely low prices in comparison to the long-haul carriers. This has meant that, BA and Virgin have had to search for ways in order to reduce their prices and offers services which could contend with Ryanair and easyJet.
Flybe however has not been as successful as easyJet and Ryanair, and this has been highlighted in their financial analysis, with poor performances in terms of ratios, Flybe are still searching for ways to become contenders for easyJet and Ryanair, whose success has soared through the past five years.
- Appendixes
8.1 Ratios for the five chosen companies
8.1.1 British Airways Plc:
8.1.2 easyJet Airline Company Ltd:
8.1.3 Flybe Ltd:
8.1.4 Ryanair:
8.1.5 Virgin Atlantic Airways Ltd:
8.1.6 Aviation Industry Ratios:
Current Ratio – Gearing Ratio, Aviation Industry Ratios (Global Business Browser, 2009)
EPS – Dividend Yield (This is Money, 2009)
(Annual Reports – Flybe Ltd and Virgin Atlantic Airways)
Industry Specific Ratios (CAA, 2009)
8.2 Ratio comparison for all five companies
1 = Poorest Ratio
5 = Best Ratio
8.3 SWOT Analysis
8.3.1 British Airways Plc:
8.3.2 easyJet Airline Company Ltd:
8.3.3 Flybe Ltd:
8.3.4 Ryanair:
8.3.5 Virgin Atlantic Airways Ltd:
- References
ACCA Global (2009) A brief insight into accounting ratios [online]. Available from: [Accessed 03/01/2009].
Anon. (2003) FX: Dollar drifts downwards. Airfinance Journal. 1.
Anon. (2005) FACTFILE: No frills carriers continue to climb. Marketing Week. 30.
BBC (2009) Go-ahead for new Heathrow Runway [online]. Available from: [Accessed 27/01/2009].
BBC (2009) Protestors buy up Heathrow Land [online]. Available from: [Accessed 27/01/2009].
British Airways Plc (2008) About British Airways [online]. Available from: [Accessed 30/12/2008].
British Airways Terminal 5 (2008) Welcome to Terminal 5 [online]. Available from: [Accessed 31/12/2008].
BBC (2009) UK in Recession as economy slides [online]. Available from: [Accessed 16/03/2009].
British Airways (2009) On Board BA [online]. Available from: [Accessed 22/03/2009].
Business Week (2009) British Airways sees more red ink [online]. Available from: [Accessed 17/03/2009].
Bureau of Transportation Statistics (2009) Airline Travel since 9/11 [online]. Available from: [Accessed 26/04/2009].
Civil Aviation Authority (2008) About the Civil Aviation Authority [online]. Available from: [Accessed 31/12/2008].
Civil Aviation Authority (2009) UK Airline Statistics [online]. Available from: [Accessed 14/03/2009].
Doganis, R. (2006) The Airline Business. 2nd Edition. New York: Routledge.
easyJet (2008) Introduction to easyJet [online]. Available from: [Accessed 30/12/2008].
Flybe (2008) Company Information [online]. Available from: [Accessed 30/12/2008].
Flyer Air Portal (2009) easyJet plans greener airliner [online]. Available from: [Accessed 25/03/2009].
Financial Times (2009) Airline industry in ‘intensive care’ [online]. Available from: [Accessed 23/04/2009].
Great Green List (2009) Aviation and climate Change [online]. Available from: [Accessed 25/01/2009].
Gross, D. (2008) Silver linings in the sky? A recession may actually be good news for fliers stressed out over delays. Already the number of flights is decreasing. Newsweek. 151(16).
Guardian (2009) News in Brief [online]. Available from: [Accessed 26/03/2009].
Gael Community (2009) Countdown to paperless airline ticketing [online]. Available from: [Accessed 20/03/2009].
Global Business Browser (2009) Virgin Atlantic Airways Ltd [online]. Available from: [Accessed 14/03/2009].
Global Business Browser (2009) British Airways Plc [online]. Available from: [Accessed 14/03/2009].
Global Business Browser (2009) easyJet Plc [online]. Available from: [Accessed 14/03/2009].
Global Business Browser (2009) Flybe Group Ltd [online]. Available from: [Accessed 14/03/2009].
Global Business Browser (2009) Ryanair Holdings Plc [online]. Available from: [Accessed 14/03/2009].
Guardian (2009) Ryanair boss’s plan for £10 flights to Us flies in face of plunging profits [online]. Available from: [Accessed 24/03/2009].
Heathrow Airport Guide (2008) Expansion of Airports [online]. Available from: [Accessed 31/12/2008].
Hotel World (2009) Flybe picks up two prestigious carrier awards [online]. Available from: [Accessed 26/03/2009].
IATA (2009) Making a Safe Industry even Safer [online]. Available from: [Accessed 25/01/2009].
Investopedia (2009) Dividend Yield [online]. Available from: [Accessed 12/04/2009].
Karp, A. (2008) Soaring Costs Fuel Losses. Airtransport World. 45(9), 81-82.
Library of Economics and Liberty (2008) Airline Deregulation [online]. Available from: [Accessed 31/12/2008].
Ludwig Von Mises Institute (2009) Fear of Monopoly [online]. Available from: [Accessed 27/01/2009].
Massachusetts Institute of Technology (2009) Airline Industry Overview [online]. Available from: [Accessed 17/01/2009].
Metric Stream (2009) Safety in Airlines – Road to Safer Skies [online]. Available from: [Accessed 25/01/2009].
O’Connor, W. E. (2001) An Introduction to Airline Economics. 6th Edition. Greenwood Publishing Group.
Ottawa Group (2008) E-commerce and consumer behaviour [online]. Available from: [Accessed 02/01/2009].
One World (2009) Airline Alliances [online]. Available from: [Accessed 22/03/2009].
Qantas (2009) Oneworld Alliance [online]. Available from: [Accessed 25/01/2009].
Ryanair (2008) About Us [online]. Available from: [Accessed 30/12/2008].
Ryanair (2009) Live Flight Information [online]. Available from: [Accessed 23/03/2009].
RTE Business (2009) Airline shares fall again amid flu scare [online]. Available from: [Accessed 29/04/2009].
Swarbrooke, J., Homer, S. (2007) Consumer Behaviour in Tourism. Essex: Butterworth – Heinemann.
The Boeing Company (2009) Boeing’s New Airplane [online]. Available from: [Accessed 03/01/2009].
The Financial Express (2009) Beginning of a new era: airlines all set to fly high with paperless tickets [online]. Available from: [Accessed 03/01/2009].
Telegraph (2009) Online check-ins get off to a flying start [online]. Available from: [Accessed 03/01/2009].
Tutor2u (2009) Main Accounting Ratios [online]. Available from: [Accessed 04/01/2009].
Telegraph (2009) Airline passenger numbers continue to fall [online]. Available from: [Accessed 17/03/2009].
This is Money (2009) Companies & Markets – British Airways [online]. Available from: [Accessed 14/03/2009].
This is Money (2009) Companies & Markets – Ryanair Holdings [online]. Available from: [Accessed 14/03/2009].
This is Money (2009) Companies & Markets – easyJet [online]. Available from: [Accessed 14/03/2009].
This is Money (2009) Virgin challenges BA with bmi bid [online]. Available from: = [Accessed 21/03/2009].
This is Money (2009) Ryanair boss hedges his bets on oil price [online]. Available from: [Accessed 21/03/2009].
This is Money (2009) Now Stelios stirs it over easyJet growth [online]. Available from: [Accessed 25/03/2009].
This is Money (2009) Rocky ride for easyJet as boss offloads shares [online]. Available from: [Accessed 24/03/2009].
This is Money (2009) City news in brief: easyJet, RBS pubs, Northern Rock, Dunlop Motorsport [online]. Available from: [Accessed 26/03/2009].
The Herald (2009) Ryanair boss: I am serious about onboard toilet fees [online]. Available from: [Accessed 23/03/2009].
Times Online (2009) Ryanair’s £60 suitcase threat [online]. Available from: [Accessed 21/03/2009].
The Independent (2009) Flybe beats challenges to post profits rise [online]. Available from: [Accessed 25/03/2009].
This is Money (2009) Financial mail cit news: Flybe, bmi, easyJet, Aegis, Moss Bros [online]. Available from: [Accessed 26/03/2009].
Tutor 2u (2009) Strategy – SWOT Analysis [online]. Available from: [Accessed 22/03/2009].
University of California San Diego (2009) Efficient Transportation Routing and Natural Monopoly in the Airline Industry [online]. Available from: [Accessed 27/01/2009].
U.S. Centennial of Flight Commission (2008) Air Transportation Deregulation and its Consequences [online]. Available from: [Accessed 31/12/2008].
Universal Teacher 4u (2009) Ratio analysis [online]. Available from: [Accessed 29/04/2009].
Value Based Management (2008) PEST Analysis [online]. Available from: [Accessed 30/12/2008].
Virgin Atlantic Airways Ltd (2008) All About Us [online]. Available from: [Accessed 30/12/2008].
Virgin Aircrew Lies (2009) Virgin Atlantic Airways [online]. Available from: [Accessed 21/03/2009].
Wallis, R. (2003) How Safe are Our Skies? Assessing the Airlines’ Response to Terrorism. Greenwood Publishing Group.
3g (2009) Enabling Mobile Phone use on Aircrafts [online]. Available from: [Accessed 03/01/2009].