The Rt Hon. Lord Baker of Dorking is a member of a wide range of boards in not only non-executive positions but also as chairman for organisations such as The Belmont Press Ltd. He brings contacts to Hanson PLC through his role as MP, most recently holding the position of Home Secretary.
Frank Blount also holds roles such as being executive of JI Ventures, Inc and Chairman of Cypress Communications, Inc. He came to the company after its take over of Pioneer International Ltd where he was previously a non-executive director. What is important is his role as a director of Caterpillar Inc.
David Hoare also joined Hanson PLC after its takeover of Pioneer International Ltd. David does not only hold directorships at Hanson but is also chairman of ASXSR Ltd and holds board positions at the University of Sydney and the Australian School of Management.
Simon Keswick is Director of Jardine Matheson Holdings Ltd, Matheson & Co Ltd and Jardine Lloyd Thompson Group PLC. He also holds a range of positions as chairman including those at Dairy Farm International, Hongkong Land, Mandarin Oriental and The Fleming Mercantile Investment Trust PLC.
The Baroness Noakes is a non-executive director of Carpetright Plc and a trustee of the Reuters Founders Share Company. She is also a member of the Council of the Institute of Business Ethics. and was formerly director of finance and corporate information on the NHS Management Executive. She is also a member of both the Takeover Panel and the Private Finance Panel.
John Schubert was previously managing director and chief executive of Pioneer International Ltd but became a non-executive director of Hanson after it took over Pioneer International. He also holds the position as director at Quantas Airways Ltd, the Australian Graduate School of Management, and the Great Barrier Reef Research Foundation.
Word Count: 303
The combined code states the number of independent and capable non-executive directors which should be assigned to each of the committee in a business and on the board. If you look at Appendix 6 the number of non-executive directors is met and so in that sense the board obeys the combined code. However there are several questions about the independency of some of the directors and the effects that they could have on the decision making of the board. The first of these questions is to do with John Schubert and David Hoare who were executive directors of Pioneer International but later became non-executive directors of Hanson PLC when Hanson took over Pioneer. Therefore the question is about how independent they are as behind the scenes they may have been asked to agree to certain decisions in order to guarantee them a job as both of them are at retirement age! There are further questions asked about the links to industry that Baroness Noakes has with the Takeover Panel as Hanson has just carried out several significant takeovers which may have been affected by her position and those which Frank Blount has with Caterpillar who will be a major supplier of equipment to Hanson PLC.
Word Count: 204
Task 3
Hanson PLC’s remuneration package consists of the Annual Bonus Scheme, a Long Term Incentive Plan, a Share Option’s, a Share Saver Scheme, Salary, Benefits and Pension Plan. The basic remuneration package is made up of the Bonus Scheme, Salary and Benefits – a full breakdown of which are detailed in Appendix 3. The total of this basic remuneration package for the executive directors is detailed below.
Table 4 – Illustrating the Total Remuneration Packages of the
Executive Directors (excluding share options, LTIP, Share Saving Schemes and Pension Plans)
Under the remuneration policy of Share Options these directors have available to them ungranted share options which are illustrated below:
Table 5 – Ungranted Share Option Value
Although these Share options are yet to be granted; several directors have been granted some of their entitled share options; the value for these is illustrated below:
Table 6 – Granted Share Options
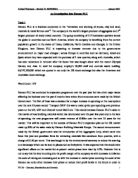
The aim of remuneration packages is to align the interests of the shareholders with those of the directors this is known as goal congruence. In order to analyse if this is taking place I have created a graph representing the % changes in these 3 variables year on year. What this graph does not tell us though and that Appendix 2 does is that in 1999 the share value was high for the majority of the year (inline with the high profits) but then in the last quarter of the year and into the next half of 2000 the share value plummeted considerably (inline with the profits) until the second half of 2001 where it began to pick up again (the profits did not begin to increase again but this could be to do with the companies expansion programme). Therefore because of this you would expect the director’s salaries be high in 1999 and then during 2000 not to increase at all due to the poor performance; instead what happened is that even when the businesses financial situation was decreasing the directors were still given larger remuneration packages. This shows that during this time at Hanson PLC goal congruence was not being achieved.
Word Count: 203
Image 3 – Graph Representing % Changes in Profit, Share Value and Executive salary during 1999-2001
Task 4
After reviewing the annual report there do not appear to be any differences in the types of share available on the market – however because the Hanson PLC shares are on 3 different stock markets across the globe’ depending on which market you are trading in will decide what you are entitled to. Therefore Hanson PLC shares on the American Stock Market are equivalent to 5 ordinary shares as found in the Australian and UK stock markets.
As the table in Appendix 6 illustrates the total number of Hanson PLC shares in circulation comes to 735,162,855. Therefore at the current market price of 265p the Total Market Capitalisation of the company comes to £1,948,181,566.
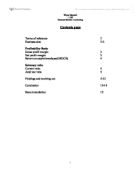
As detailed in the annual report there are several shareholders who hold more than 3% of the shares in the company and therefore are classed as being significant shareholders within the company. A detailed summary of exactly how many shares are held by each of these institutions is shown in Appendix 6. A summary of this information and the % held by each of these groups in comparison with the total number of share holders is illustrated below.
Image 4 – Pie Chart representing the breakdown of shares within Hanson PLC Source Data in Appendix 6
A breakdown of the amount of shares held by the directors within Hanson PLC is detailed in Appendix 5, none of the directors are classed as significant shareholders as even when placed together their total power over the business only comes to 0.08%.
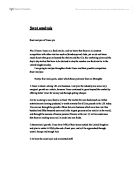
The following three graphs represent changes in the business over the past 5 years from which I hope to identify if the directors of Hanson PLC have met their objective and ‘maximised the wealth of the shareholders’ as described by A Berle and G Means. The first of these represents the dividends paid over the 5 years. If we look at this graph we can see that these have risen steadily over the 5 year period and so as increased dividends are one of the sources of increased profits to the shareholder this graph would point to the idea that the directors have maximised the profits of the shareholder over that time. The question is if these amounts of dividends are in line with the profits, how much money has been put back into the business etc? This is something I will look at in Image 7.
Image 5 – A Graph Representing the Change in Dividend Value’s over the period 1997 – 2001
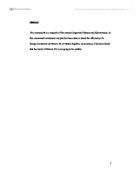
The second graph represents how the share has performed in line with the FTSE 100 as the second source of shareholder profit is through the increase in share value to later be sold on to other shareholders at a profit. The graph shows us that over the 5 year period the share has moved up and down in line with the FTSE 100 which shows us that the company is Market Specific and will be effected by changes in the market rather than just the companies own decisions. Therefore as the FTSE 100 will represent changes in inflation in order for the share value of Hanson to be classed as profitable it has to be higher that that of the FTSE 100 average, and it is. As the graph shows the share has risen significantly in price over the past 5 years above the level which the FTSE 100 has and therefore this points towards the fact that the directors have maximised the shareholders wealth as they have increased the share value.
Image 6 - Graph Representing the Change of Hanson PLC’s Share Value over the past 5 years in comparison with the FTSE 100.
Finally the third graph will tell us if increases in the dividend value are in line with the profits. As if the increase in profits is larger than the increase in dividends then the share holder might begin to ask why they haven’t seen a larger proportion of the profits. Instead after reviewing this graph it shows us that profits in the company have been reduced significantly (this could be to do with the companies recent expansion programme which would result in increased share value’s which I identified previously); and yet the dividend value’s have still risen by 2p per share over the 5 years. This may not seem much but with 735,162,855 shares in circulation this is the equivalent to £14,703,257.
Image 7 – A Graph Representing the Change in Hanson PLC’s Profit Before Tax over the period 1997 - 2001
Therefore in conclusion it can be seen that over the last 5 years the directors have increased dividends even though profits are reduced, and have increased share value and therefore have met all criteria in their aim of ‘maximising the wealth of the shareholders’.
Word Count: 485
Bibliography
Image 1 – A graph representing the change in share value of Hanson PLC over the past 2 years - Accessed: 30/12/02
Image 2 - Graph Representing the Change in Share Value’s of Hanson PLC in Comparison with the Construction Materials Group of the FTSE -http://www.advfn.com/cmn/chrt/draw_chart.php?epic=HNS&type=1&size=2&period=6&olx_1=1&o_epic1=&o_type1=1&o_colour1=1&olx_2=2&o_epic2=UB13&o_type2=1&o_colour2=2&scheme=&delay_indices=1 Accessed: 30/12/02
Image 3 – Graph Representing % Changes in Profit, Share Value and Executive salary during 1999-2001. Source: Appendix 1
Image 4: Pie Chart representing the breakdown of shares within Hanson PLC Source Data in Appendix 6
Image 5 – A Graph Representing the Change in Dividend Value’s over the period 1997 – 2001 Source: Appendix 4
Image 6 - Graph Representing the Change of Hanson PLC’s Share Value over the past 5 years in comparison with the FTSE 100. Source: Accessed: 28/12/02
Image 7 – A Graph Representing the Change in Hanson PLC’s Profit Before Tax over the period 1997 – 2001. Source: Appendix 4
Table 1 – Table of financial variables for further analysis in Question 3 Part C - Taken from the Annual Reports published by Hanson PLC dated 1999, 2000, 2001 published by St Ives Westerham Press.
Table 3 – Illustrating the Remuneration Packages of the Executive Directors (excluding share options, LTIP, Share Saving Schemes and Pension Plans) - Taken from the Annual Reports published by Hanson PLC dated 2001 published by St Ives Westerham Press.
Table 4 – Illustrating the Total Remuneration Packages of the Executive Directors (excluding share options, LTIP, Share Saving Schemes and Pension Plans) - Taken from the Annual Reports published by Hanson PLC dated 2001 published by St Ives Westerham Press.
Table 5 – Un-granted Share Option Value - Taken from the Annual Reports published by Hanson PLC dated 2001 published by St Ives Westerham Press.
Table 6 – Granted Share Options - Taken from the Annual Reports published by Hanson PLC dated 2001 published by St Ives Westerham Press.
Table 7 – Illustrating the total dividends paid per ordinary share to the shareholders of Hanson PLC – Source: Annual Reports published by Hanson PLC dated 1997, 1998, 1999, 2000, 2001 published by St Ives Westerham Press.
Appendix 1 - Table of financial variables for further analysis in Question 3 Part C - Accessed: 30/12/02
Appendix 2 – A graph representing the change in share value of Hanson PLC compared with the value of the FTSE 100 over the 3 year period 1999 – 2001 - Accessed: 28/12/02
Accessed: 28/12/02
Appendix 5: - Table of Shareholders in Hanson PLC – Source: Annual Reports published by Hanson PLC dated 2001 published by St Ives Westerham Press.
Appendix 6 – Layout of Board of Directors. Source: Annual Reports published by Hanson PLC dated 2001 published by St Ives Westerham Press.
Appendix 1:
Table 1 – Table of financial variables for further analysis in Question 3 Part C
Table 2 – Calculated % changes in the variables detailed in Table 1
Appendix 2:
A graph representing the change in share values over the 3 year period 1999 - 2001
Appendix 3:
Table 3 – Illustrating the Remuneration Packages of the Directors (excluding share options)
Appendix 4:
Table 7 – Illustrating the total dividends paid per ordinary share to the shareholders of Hanson PLC
Appendix 5: Table of Shareholders in Hanson PLC
Taken from the Fame database. Source
The company was contacted but no other information was provided.
Jonathan Nicholls is not quoted in the current Annual Report as having Share Options available to him although he does have shares available to him through the LTIP.
Although these are only 4 out of the 6 other Executive Directors, no other directors were reported to of received remuneration in the annual report.