Title: Investment Analysis about two companies.-Pratt Ltd and Dana Ltd.
To: Potential shareholder
Student Name:
ID Number:
Executive Summary
According to a detail investment analysis by assessing performance, efficiency and financial stability between two companies, we may find a company that is suitable for investment. During the period of analysis, accounting ratios are utilized to direct the discussion. However, there are some limitation relates to ratio analysis, which can be addressed further. At last, a company would be recommended by combining discussion of many factors.
Table of Contents
Introduction……………………………………………………..4
Profitability……………………………………………………..5
Efficiency……………………………………………………….5-6
Financial Stability……………………………………………….6
Short-term……………………………………………..6
Long-term……………………………………………...6-7
Limitation………………………………………………………….8
Timing problems……………………………………………8
Information Base…………………………………………….8
The End Use………………………………………………….8
Recommendation……………………………………………………..9
Reference List…………………………………………………………10
Introduction
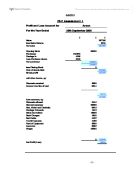
Potential shareholder faces two options about whether investing in Pratt Ltd or Dana Ltd. According to detail information from financial statements, we can use accounting ratios to make a better prediction and analysis about potential advantages and drawbacks in investing in one of these companies. Through interpretation of accounting ratios, we can look closely at the financial state of two companies-profitability, efficiency, and financial stability, and then decide which company to invest in.
Profitability
Profitability relates to companies’ past and future performance, according to Jacklin.et.al(2007), performance is important , not only because it determines investment returns, but also the analysis of performance may provide a good indicator of the risk of bankruptcy. There are a number of ratios that assist in predicting performance. The first one is gross profit margin, which is represented by net sales divided by gross profit. The ratio calculated in Pratt Ltd is 31.2%, while 37% in Dona LTD, which reveals that every dollar sales of returns 0.37$ in Dona is better than 0.31$ in Pratt, after deducting the cost of goods sold. The second ratio is selling expense ratio, which can be represented by sales divided by selling expense. This measures the relative importance of various expenses in the earning of profit by comparing them to the sales for the period. The result is 3.6% in Pratt, compared with 3.9% in Dana, which indicates higher sales revenue involves higher expenses in Dana than in Pratt. The next one is net profit margin, which measures net sales divided by earnings after interest tax. This reflects final return to shareholders, the result got is 8.9% in Pratt, 10.5% in Dona. Dona achieves a better return for shareholders. The quality of income ratio focus more on cash generated, it is a measure of management’s efficiency. The result got is 43.5% in Pratt, 4.1%in Dana, which indicates that a lower quality of income occurs in Dana, which relates to the level of income in the form of cash flow. The next one is asset turnover ratio, which measures the relationship of sales to total assets. It indicates how effective it is in generating sales from total investment in assets. The result got is 4.86% in Pratt, compared with 4.28% in Dana, which beyond the industry average level. Assuming valuation used the same for each company, the ratio reveals that for every dollar of investment in assets, Pratt produced more sales than Dana. The next ratio is return on assets, which shows earnings from using the total investment in assets results from net profit margin and asset turnover; we can compare firms on their performance in generating profit from their investment in assets. The result is 57.75%% in Dana, which is higher than Pratt’s 56.76%. Both ratios indicate good operating performance, compared with industry average’s 54.39%. However, it is clear that Dana produce more profit than Pratt. Given their low asset turn over rate, Dana has a higher return on sales, because both them are the same type of furniture store. The last ratio to evaluate operating performance is return on equity, which combines the impacts of performance and financial structure. Jackling.et.al(2004) indicates the success or failure of management in using leverage to improve owners’ returns, when compared with ROA. Dana produces 79.87% in ROE, while Pratt brings 78.35%. Both firms experiences better performance than industry average. However, it is wise to chose Dana because more returns can be achieved by the use of leverage.