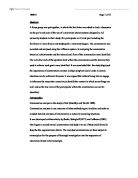
10x 1x 0.1x
Source adapted from Harvard Business Review
Elaboration of the BCG Matrix cells:
Question Marks signify business units that have a low relative market share and are positioned in a high growth industry that requires a fairly enormous amount of cash in order to maintain or gain market share (Lechner and Floyd, 2012: 460). They entail the need to be able to determine if whether the venture can be practical and are generally new goods and services which have a good commercial forthcoming. However, the question marks also known as the problem child has the potential of gaining market share and becoming a star and eventually a cash cow when the market share slows down (Lechner and Floyd, 2012: 460). Therefore, the question marks failure to become the market leader will then possibly after years of cash consumption it will relapse into a dog when the market diminishes. Thus, question marks must be evaluated with caution in order to be able to determine if whether they are of significance importance to the investment that is required to grow the market share (Lechner and Floyd, 2012: 460).
Stars represent the different business units that have a large market share in an industry that is growing rapidly and they may generate cash but because of the fast growing market, they require a massive investment so that it can be able to maintain its lead (Lechner and Floyd, 2012: 460). However, the net cash flow is usually modest because the SBU’s situated in this cell are attractive as they are positioned in a tough industry where the business units are highly competitive in the industry and if it is successful, the star will develop into a cash cow when the industry is better established (Lechner and Floyd, 2012: 460).
Cash cows represent a business unit that has a large market share in a mature but growing industry and they require a little bit of investment because they generate cash that can be utilized for investment in other business units within the same industry (Lechner and Floyd, 2012: 460). The SBU’s are the corporations’ main source of cash and are particularly the business core. However, cash cows are also the base of an organization where businesses usually follow strategies of stability and when they loose their appeal and move towards weakening, then a retrenchment policy may be implemented (Lechner and Floyd, 2012: 460).
The last cell being dogs represent businesses that have a weak market shares in low-growth markets and they neither produce cash nor require an enormous amount of cash (Lechner and Floyd, 2012: 460). Therefore, because of the of the low market share, these business units are faced with costs disadvantages leading to retrenchment policies to be implemented in order to be able to help these firms gain market share at the competitor or rivals expense (Lechner and Floyd, 2012: 460).
However, the BCG matrix produces a framework with the allocation of resources among the different business units found in the industry making it possible to compare the business units at a momentary look and the matrixes has limitations and are as follows: the BCG matrix classifies business as low and high forgetting the fact the a business can also be regarded as medium restricting the proper nature of the business to be revealed (Lechner and Floyd, 2012: 460). Furthermore, the model cannot properly define market and the high market share does not constantly lead to high profits but there are high costs that are associated with high market share (Lechner and Floyd, 2012: 460). The model’s growth rate and relative market share are not the only key indicators of profitability as it ignores and sometimes overlooks other possible indicators of profitability (Lechner and Floyd, 2012: 460). As a result the dog can sometimes help other businesses in increasing competitive advantage so that they can be able to earn even more than cash cows, thus this model (four-celled approach) is regarded to be too simplistic (Lechner and Floyd, 2012: 460).
General Electric Business Screen (GEBS)
In contrast, the General Electric Business Screen (GEBS) was initially developed to be able to help managers in the marketing sector to overcome the problems that they were experiencing with the BCG matrix such as lack of credible business information, the fact that BCG mainly concentrates with commodities not brands and cash flow if it is regarded as a more reliable indicator of position as opposed to market growth or share (Collis, Campbell and Goold, 2009:123).
However, the GEBS introduces a three by three matrix that includes a medium category in order to utilize the industry’s attractiveness as a more comprehensive measure than the BCG matrix and substitutes the competitive position for the original market share and the illustration will be below (Collis et al, 2009:125):
(Source: Adapted from Collis et al, 2009:124).
Furthermore, the GEBS has nine cells while the BCG matrix has only four meaning that large corporations are allowed to have many SBU’s which can fundamentally operate under the same strategy but with the difference isthat they are individual firms and distinctive (Collis et al, 2009:124). The GEBS replaces the growth/share analogy with competitive position and market attractiveness so that successful SBU’s can do well in attractive markets and add value that customers will pay for (Collis et al, 2009:124).
In addition, GEBS calculates the industry attractiveness and business unit strength but it firstly starts identifying the criteria for each cell, determining the parameter value in each criteria, and multiplying that value by weighting a factor, and this results in a quantitative measure of industry attractiveness and the business unit’s relative performance in that industry (Collis et al, 2009:124).
However, the vertical axis of the GEBS matrix represents industry attractiveness which is determined by the factors such as market growth rate, market size, demand variability, industry profitability, industry rivalry, global opportunities and makroenvironmental factors(Collis et al, 2009:124). Thus, each and every factor is allocated to a weighting that is suitable for the industry and the industry attractiveness is calculated as follows:
Industry attractiveness = factor value1 * factor weighting1
+ factor value2 * factor weighting2
+ factor valueN *factor weighting
Therefore, the opposite applies for the horizontal axis of the GEBS matrix as it’s the strength of the business unit and includes factors such as market share, growth in market share, brand equity, distribution channel access, production capacity and profit margin relative to competitors (Collis et al, 2009:124). Thus, the business unit strength index can be calculated by multiplying the estimated value of each factor by the factors weighting as it is done for by the attractiveness of the industry (Collis et al, 2009:124).
Furthermore, each business unit can be represented using a circle plotted on the matrix with the market size (shown by the size of the circle), market share (shown by using the circle as a pie chart) and the expected future position (shown by the circle by means of an arrow) and can be illustrating as follows:
(Source: Adapted from Collis et al, 2009:124).
The above circle signifies a 38% market share for the strategic business unit with an upwards left direction arrow indicating that the business unit is estimated to gain strength relative to its competitors and the business unit is also estimated to gain recognition (Collis et al, 2009:125). The tip at the end of arrow shows the future position of the centre point of the circle (Collis et al, 2009:125).
However, the GEBS has strategic implication that can lead to a positives outcome on the business unit and are as follows: it helps business units grow strong in attractive industries, average business units in attractive industries and strong business units’ average industries; it is able to hold an average business in average industries, strong businesses in weak industries and weak businesses in attractive industries; and lastly being able to harvest weak business units in unattractive industries, and weak business units in average industries (Collis et al, 2009:125).
While GEBS symbolizes an improvement over the simple BCG growth-share matrix, it still presents a limited view by failing to consider the interactions among the various business units by disregarding the need to address the core competencies that lead to value creation (Collis et al, 2009:125). Thus, GEBS further fails to serve resource allocation as their primary tool for and this is evidence that portfolio matrices are better suited to displaying a quick synopsis of the strategic business units (Collis et al, 2009:125).
List of Reference
COLLIS, D.J., CAMPBELL, A. and GOOLD M., 2009. The General Electric Screen. Harvard Business Review. 40, 3:123-125.
LECHNER, C., and FLOYD, S.W., 2012. The impact of the BCG matrix in an organization. Strategic Management Journal. 33, 5:460-462.
SADLER, P. and CRAIG, J.C., 2003. Strategic Management. (2e). United Kingdom: London.
WARREN, K., 2008. Strategic Management Dynamics. London: Routledge.