Insurance
Let us now turn to the insurance operations. The firm wholly owns GEICO, which underwrites private passenger car insurance, the Berkshire Hathaway Primary Group, which underwrites property and casualty policies for commercial accounts, and General Re and the Berkshire Hathaway Reinsurance Group, both of which underwrite excess-of-loss and quota-share reinsurance for other insurers and reinsurers. Unless otherwise noted, we will aggregate data from these four companies in our analysis, treating insurance and reinsurance as a single entity on par with the conglomerate’s manufacturing, finance, wholesale, and retail business operating segments. All dollar figures, except for per-share measures, are in millions.
To analyze Berkshire insurance segment, we will consider three central points: profitability, liquidity, and leverage.
- Profitability
A) ROE and ROE
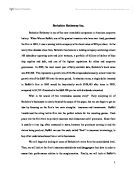
The following table presents our estimates of insurance ROA and ROE. The consolidated financial statements provide disaggregated insurance earnings and identifiable assets for the first ratio. ROE could be calculated by estimating an insurance equity base thus: the purchase price of each insurance company would form the basis for Insurance Par and Capital in Excess of Par, and the subsequent year by year Retained Earnings attributable to insurance operations would make up the difference. We have opted instead to divide insurance earnings by the conglomerate’s average equity, which understates the segment’s true ROE but allows a better comparison to the conglomerate’s non-insurance contributors to total ROE.
The loss in 2001 stems from reinsurance claims on the September 11th attacks.
B) Underwriting Income
The net underwriting gains (losses) of Berkshire Hathaway’s insurance businesses for the past three years have improved. By the end of 2003 it was $1,114 compared to ($284) in 2002 and ($2,654) in 2001.
- Written Premium Growth Rate. To analyze underwriting result, the industry benchmark is rate of written premium growth.
- The combined ratio. A key measure of underwriting performance. This ratio equals the sum of the loss ratio—dividing losses and loss adjustment expenses by earned premiums, the expense ratio—dividing operating expenses by written premiums, and the dividend ratio—dividing policyholders’ dividends by earned. A combined ratio below 100% indicates an underwriting profit; one above 100% means an insurer has incurred an underwriting loss. A typical range for combined ratios is 100% to 110%. The loss ratio usually ranges from 60% to 80%, and the expense ratio from 25% to 35%. The dividend ratio usually ranges from 1.0% to 2.0%.
For the 12 months ended December 31, 2003, the industry’s combined ratio equaled 100.1%, compared with 107.3% in the year ended December 31, 2002. The combined ratio for 2003 consisted of a loss ratio of 74.7% (versus 81.4% in the 2002 period), an expense ratio of 24.9% (25.4%), and a dividend ratio of 0.5% (0.6%).
C) Investment Income
We will discuss Buffett’s investment philosophy at the end of this report, but a few words on the subject of investments with respect to the insurance operating segment are called for here. Theoretically, investment income should be used to provide financial protection against unforeseen and unanticipated underwriting losses. Many insurers, however, have come to rely on investment income to remain profitable. When evaluating an insurer’s investment portfolio, analysts review a company’s asset allocation strategy, making sure its mix of invested assets is appropriate for the type of business it underwrites.
Two important ratios used in analyzing investment results are the investment yield and the total return on the portfolio. Investment yield is usually calculated as the net investment income during a certain time period, divided by the portfolio’s average value during the same period.
- Net investment yield. This is a measure of investment performance; it is typically calculated as net investment income divided by average invested assets. Investment yields typically range from under 4% to well above 12%, depending on the mix of invested assets in an insurer’s portfolio. For the property-casualty industry, the average yield on invested assets was 4.9% in 2002, unchanged from 2001.
- Total Return on the portfolio. Total return is usually calculated as net investment income plus or minus realized and unrealized gains, divided by beginning market value of the portfolio, plus or minus the weighted average of additions or dispositions.
II. Liquidity
A) Current ratio
Current assets divided by current liabilities.
-
Debt as a percent of net working capital
Long-term debt (excluding current portion) divided by the difference between current assets and current liabilities. It is an indicator of a company’s liquidity.
III. Leverage
Berkshire Hathaway’s insurance businesses maintain extraordinary capital strength. Their statutory surplus totaled approximately $40.7 billion at December 31, 2003. This superior capital strength creates opportunities, especially with respect to reinsurance activities, to negotiate and enter into insurance and reinsurance contracts specially designed to meet unique needs of sophisticated insurance and reinsurance buyers.
- Net premiums written to surplus. This ratio measures the extent to which the industry (or an insurer) has leveraged its capital to write business. Sometimes referred to as a measure of capacity utilization, it is equal to net written premiums divided by policyholders’ surplus.
Typically, regulators permit an insurer to have a ratio of net written premiums to surplus of 2-to-1. In other words, insurers would be permitted to write $2 in premiums for every $1 in capital. Despite the growth in written premiums that occurred in the 12 months ended December 31, 2003, the industry remained somewhat underleveraged. At December 31, 2003, the ratio of net written premiums to policyholders’ surplus was 1.17-to-1. In other words, the industry wrote $1.17 worth of premiums for every $1 in capital.
Investments
No report on Berkshire Hathaway would be complete without at least a cursory mention of Buffett’s philosophy of value investing. Such mention is especially appropriate in a report on ratio analysis because Buffett’s philosophy depends heavily upon the fundamental analysis of financial statements. This approach stands in stark contrast to the tenets of modern portfolio theory, which studies the statistical properties of the price movements of individual securities, portfolios, and markets from more of a technical analysis perspective.
Many people influenced Buffett’s investment philosophy, but the most important by far was Benjamin Graham, the famous Columbia finance professor. Graham’s philosophy of value investing, rooted in the aftermath of the Great Depression, can best be summarized with the words “Margin of Safety,” by which he meant that one should first calculate the intrinsic value of a security and then only purchase it when the market price drops below the intrinsic value. Buffett modified Graham’s method of calculating intrinsic value, which relied on net asset values and low P/E ratios, by instead discounting a firm’s future cash flows back to their present value, but the underlying purpose is the same: do not overpay for a security, and it is less likely that you will lose your money.
There are many contrasts between this philosophy and modern portfolio theory, but two will have to suffice. First, according to the Efficient Market Hypothesis, in its semi-strong form, all publicly available information in a firm’s financial statements is already reflected in its stock price, making a margin of safety impossible. Buffett is able to use the prevalence of this theory to his advantage, snapping up shares in high ROE, low debt companies with good long-term prospects when the market over-reacts to temporary bad news with a sell off. Second, according to modern portfolio theory, risk is defined as a security’s (or portfolio’s) covariance with the market. Buffett, however, does not view stocks as mathematical abstractions; for him, risk consists of buying bad companies or overpaying for good ones. A sharp drop in price may increase a stock’s beta, making it riskier from a modern portfolio theory perspective, but if the company is fundamentally sound such a drop in price actually makes it less risky for Buffett because its margin of safety is that much bigger.
The results of Buffett’s philosophy speak for themselves, as can be seen by looking at his three largest stock positions. His $1.47 billion stake in American Express was worth $7.312 billion in 2003, while his stake in Coca-Cola grew from $1.299 to $10.15 billion, and his initial $600 million investment in Gillette has grown to $3.526 billion. Indeed, Berkshire’s entire $35.287 billion portfolio was acquired for a mere $8.515 billion.
Financial ratio analysis has shown us how the twin engines of insurance and investment have filled Berkshire Hathaway’s coffers and made Warren Buffett the second richest man in the world. Robert Rubin, former Secretary of the Treasury and Co-Chairman of Goldman Sachs, perhaps summed it up Buffett’s approach best when he wrote, “Today I believe even more strongly that this is the only sensible approach to investing in stocks. You should analyze the economic value of a share of stock the same way you would think about the economic value of the whole business.”[fn, Rubin, p. 68.]
Bibliography
Berkshire Hathaway Annual Report, 1999-2003.
Hagstrom, Robert G., The Warren Buffett Way, New Jersey, 2005.
Rubin, Robert, In an Uncertain World: Tough Choices from Wall Street to Washington, New York, 2004.