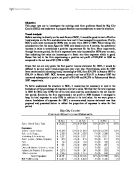
It can also be seen that BCC has been increasing its debt structure over the years. The most alarming increase lies in its sales tax payable which is an astonishing 806% larger they were in 1995. This will definitely be of legitimate concern as BCC currently has no cash on hand and there might be difficulty in paying off this large amount of payables when they are due. Another concern is in the firm’s capital holding. The firm has been showing a decrease in capital over the years and while increasing its liabilities, it is evident that the overall debt structure is becoming risky.
The last 2 tables on the previous page show the common-sized balance sheets of BCC and they are in line with our earlier findings. We can see that the firm’s accounts receivables have steadily increased from 79% in 1995 to 92% in March 1997.Similarly, sales tax payable has also increased from 15% to 42% over the same time period. Also while accounts payable was 401% larger in March 1997 as compared to 1995, it can be seen from the common-sized statements that this increase is not substantial as accounts payable has been rather consistent for BCC, hovering between the ranges of 0-2% over the years. Finally, capital has also decreased significantly, from 130% in 1995 to 11% in March 1997.
Financial Ratios
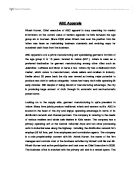
As mentioned, there is limited data given for BCC but we are still able to calculate a few important ratios as shown above. It is important to note that there are some assumptions and adjustments made in order to derive the figures. Firstly, the number of days used to compute the days receivables outstanding ratio is adjusted according to the time frame, for example the number of days used for 1995 is 245 as the firm is only in operation for 8 months that year. Secondly it is assumed that all sales made by BCC are primarily credit sales and instead of using the average accounts receivable figures, absolute figures are used instead.
From the ratios, though BCC’s current ratio is showing a slight increasing trend in the first quarter of 1997 but on the whole, it has decreased significantly from 2.16 in 1995 to 1.47 in March 1997. A major reason for the decline in current ratio was the growth in BCC’s current liabilities, namely, its sales tax payable. This could be an indication that the firm’s short-term solvency has deteriorated.
From 1995 to 1996, it can be seen that that accounts receivable turnover rose from 4.14x to 6.39x with the days receivables outstanding declining from 59.12 days to 57.16 days over the same period. This indicates that BCC collected its accounts in 57.16 days on average in 1996, an improvement over 1995’s 59.12 days. As for the first quarter of 1997, it appears that it is difficult to do any valid comparison on accounts receivable turnover but for the days receivables outstanding, it has fallen to 49.18 days in March 1997, again an improvement over 1996. However given the company’s stated credit term is 14 days, it appears that BCC is still rather inefficient in its collection effort and the quality of its receivables have also most likely not improved much. This could be a major concern as it means the firm is not collecting back its receivables fast enough while it continues to incur expenses every month. This could be the most likely reason explaining BCC’s cash flow problems.
Cash Flow Analysis
Cash is certainly vital for survival for every firm in any industry and in this section; we attempt to come up with BCC’s yearly cash flow statements for 1995, 1996 and monthly cash flow statements for the first quarter of 1997 to better understand the cash situation of BCC. These are shown below.
The cash flow statement for 1995 reflects that of most start up companies, where they often have a negative net cash flow from operating activities and investing activities. Interestingly, in 1996, it can be seen that BCC had a positive net cash flow of $16,093 from operating activities, led by a positive net income and the increase in sales tax payable. However for the same period, BCC did not experience any increase in its cash and cash equivalent position. The main reason for this lies in the decrease in capital for that year, falling by $18,426. We have to look closer into the monthly cash flow statements for 1997 to ascertain the cause for the decrease in capital.
Before proceeding further, it has to be noted that while the balance sheets for January and February 1997 showed no cash balances, it was however reflected in the above cash flow statements that there is a deficit of $1 in January and a positive $1 in February. This is a minimum amount and it is possibility due to a rounding error in the marketing and advertising expenses which in turn affected the net income for the 2 periods. Hence this amount can be safely ignored. At the same time, we have decided to treat the firm’s overdraft facilities as a form of short term financing as interest is charged to it and as such, it is classified under financing activities.
The cash flow statements for each of the month in the first quarter of 1997 reflected a cash outflow in capital as well. On further investigation of BCC’s bank account transactions for the same period, the cash outflows was in fact, drawings or withdrawals, made presumably by Mr Groffrey Taylor himself as he is the owner of the business. Hence theoretically there could have been some positive cash balances for BCC has Mr Groffrey not made the withdrawals. It is unknown as to why the withdrawals were made but it could be because Mr Groffrey wanted to withdraw out the profits to cover his initial injection of capital into the firm.
At the same time, while the net cash flow from operating activities for February and March 1997 was negative, it can be seen that this was mainly caused by the huge increase in accounts receivables, which was significantly higher than net income, in those periods. As mentioned, this should be of concern because a company who holds up most of its cash in receivables is likely to face liquidity problems in futures. While accounts receivable is often considered as near cash, it is effectively still not cash and a large accounts receivable would also increase the likelihood of bad debts. In addition, as BCC has a policy of paying its drivers in every 2 weeks and with the firm’s money tied up in its receivables, this has inevitably led to the firm increasing its usage of its overdraft facilities which in turn will result in interest expenses. This can be seen from the various cash flow statements where there has been an increase in overdraft for most of the period except January 1997. At the same time, there is also a limit to the amount of overdraft ($14,000) for BCC and they will face serious short term solvency problems if it was to exceed the limit amount and yet have to finance their short term debts (payables).
Though being a small courier company, BCC often relies on their drivers providing their own vehicles but it is evident that the firm has not been spending much on expanding its business. Apart from 1995, there has been relatively no expenditure spent on investing activities. This might be unhealthy for the firm. But on the contrary, it would not be beneficial for BCC if it has to incur large amounts of debt to span its expansion as well as this will further increase the burden on the firm.
Conclusion
In conclusion, the main reasons which are affecting BCC’s cash flow problems are:
- Though the firm has improved slightly, it is still ineffective in collecting its accounts receivables, taking an average of about 50 days to collect its accounts as opposed to its credit terms of 14 days.
- The inefficient collection policy has led to the firm to increase its usage of its overdraft facilities which in turn increases its interest.
- Withdrawals are made whenever the firm experiences a positive cash flow, thus resulting in a zero cash and cash equivalent balance.
- The firm does not appear to be able to maintain a consistent expense record and this could lead to potential net losses.
Recommendations
It is recommended that:
- Despite the highly competitive industry it is in, it is necessary for BCC to tighten its collection policy and collect back its account in a much shorter period of time. This could be done by introducing better incentives for customers who are prompt in their payments. Alternatively, BCC could consider coming up with a scheme to promote some form of prepaid service. This system would work very much like a prepaid calling card, where customers will buy a certain amount of credit for courier services and they simply use the credit to offset their payments each time they use BCC’s services. This could only be viable if BCC offers a certain discount for its customers and at the same time, maintains its high quality service. This would be beneficial for BCC as it could help it to retain customers and at the same time, ensure a positive cash flow. Finally BCC could contemplate adopting a strictly cash basis transaction but bearing in mind the competitiveness of this industry, this approach might not be too feasible.
- While restructuring, BCC should approach its banker to negotiate a temporary increase of its overdraft facilities. The firm could provide evidence of an improving business and reveal its plans of restructuring to the bank. By attaining the support of its banker, it would help the firm to tide over any potential short term liquidity problems.
- BCC could also revise its current time frame of paying its drivers. As it is clear for now that the firm is unable to collect back each receivable within 2 weeks, it could consider negotiating with the drivers to perhaps pay them on a monthly basis instead of fortnightly. This would create an additional buffer for the firm for them to attempt to collect them its accounts first before paying the drivers instead of relying on its overdraft facilities so often to offset for the drivers’ commission.
- Mr Geoffray should contemplate not withdrawing the firm’s earnings every month as he is the owner of BCC after all and it might be better if he reinvests the firm’s earnings back into the firm to span further expansion.
- BCC has to also improve its control on its expenses and try to maintain consistent expenses which are lower than their net sales. This would help ensure that the firm to experience positive net profits every period and hence a greater likelihood to improve its cash flows.
- BCC should restructure its debt structure which appears to be relatively risky now with the continual withdrawals of capital and increasing liabilities. The firm should look into ways to reduce the sales tax payable figure as it is building up significantly.
- BCC should also look into ways to expand its business, like increasing the number of salesman or investing in more fixed assets which are beneficial to the operations of the business.