In the long run the costs for oil price uncertainty are very difficult to handle for oil producing countries. These countries are vulnerable to short run as well as to long run fluctuations, e.g. from investments and speculations in the oil industry.
Therefore, one of the major policies is to help oil producers to better diversify risks – today it poses in volatile oil prices. Oil producing countries are sometimes faced with quick price increases. This means higher costs for the national economy and also a decrease in terms of trades (Begg, 2009). This might be seen as an indicator for upcoming recessions.
A decreasing flow rate initially only causes that no additional customers can be controlled, since the actual flow rate is not even going back. The situation is exacerbated when it comes to an actual decline in global production and reduces the supply side (sellers market). Rising oil prices are reflected in a large number of oil-related products (Begg, 2009). Therefore, previous entrants must reduce their consumption or substitute oil with other fuels and coal and hydrocarbons with modified develop oil deposits and exploit technologies and concepts. Subject to the higher prices this can also be very lucrative.
IV. Historical Development
Supply and Demand:
The prolonged period of relatively stable oil prices since the Second World War came to an end in the early seventies. Before that, it was easier to find petroleum springs. It was simply cheaper to make them accessible.
In 1973, the OPEC slowed its oil production down in response to the outbreak of the Yom Kippur War (Hamilton, 1985, p. 110). Consequently, the price for a barrel of oil rose within a few months by 237% from the original $4.6 in October 1973 to $15.5 in March of the following year (ECB, 2004, p. 52, table 1). This price increase is commonly known as the ‘first oil price shock’ (Gómez-Loscos et al, 2012). The oil crisis of 1973 demonstrated the dependence of the industrialized countries of fossil fuels. This was the major fact for high investments in a new oil-producing region – the North Sea. In addition, the IEA (International Energy Agency) was established in 1974. The organization was found to examine the supply of oil, as well as serving as an information source on statistics regarding the international oil market and other energy sectors.
The ‘second oil price shock’ began at the end of the seventies. This was again caused by a feared shortage in connection with political tensions in the Middle East (Begg, 2009). The crises already loomed the Iran-Iraq war. The price of oil increased by 193% between the beginning of the Iranian Revolution in October 1978 and November 1979 (ECB, 2004, p. 52, table 1).
During the 80s, the oil price fell again. However, it never returned to the nominally level prior to the two price shocks. 1981 the oil sales declined. The developed countries were in a recession. As a reaction to the oil crisis and high oil prices, many countries invested in alternative energy sources. Hence, the global oil consumption was reduced by eleven percent in the years 1978 to 1983. In 1986, the price halved due to global over-production of crude oil and the attempt by some OPEC countries to improve their market position by reducing prices (Gómez-Loscos et al, 2012). The annual average was $ 14.43 per barrel (adjusted for inflation, $ 29.15).
The increasing prices of the 1970s and new technologies provided a rise in many new oil projects. On the one hand, this led to faster offer in supply. On the other hand, the demand growth was moderate low. The result was an oversupply and rising of inventories (buyers market from the 1980s onwards – until 1998). This development was just interrupted by outbreak of the Second Gulf War in 1990. It shows a peak in the price of oil in the graph. This was related to concerns about oil production in the war region. Nevertheless, it did not have the persistence of the two previous oil crises (because of the buyer market and the stockings). Therefore, the oil price shock of 1990/91 was only short-lived (Gómez-Loscos et al, 2012).
The oil glut and the falling of the oil price marked the dramatic oil year of 1998. The OPEC cartel was hopelessly at odd (Bleich et al, 2012). Large stocks of crude oil and petroleum products were store and reinforced by the Asian crisis. At the end of 1998 the oil price slumped to a 20-year low, and shrank the margins of the oil industry. A barrel of crude oil was selling for $10.
The situation was reversed completely in 1999. From 1999 until mid-2008 the graph shows a steady upward trend in oil price development. The OPEC decided to establish a price band system of 22 to 28 dollars per barrel and a significant funding cut (Chevallier, 2012). The member countries maintained at the agreed rates. As a result, world prices climbed steadily from 10 to 25-dollars per barrel of crude oil.
In 2000 the OPEC increased the production quotas 4 times (Bleich et al, 2012). Finally the member states produced a record amount of 29.5 million barrels per day. The world economic situation caused by good demand forced the high prices for crude oil. The upward trend even skipped the 35-dollar mark. Finally, an average oil price was found above 30 U.S. dollars. Only in December 2000, the prices fell abruptly backwards.
In 2001 the OPEC succeeded the price band target of 22 to 28-dollars per barrel until September. On the one hand, it was decided three times a flow rate reduction of 13%. On the other hand, the CIS (Commonwealth of Independent States) countries increased their production by 9%. However, the burst of the speculative bubble in the new market as well as the economic recession in early 2001 and finally the devastating terrorist attacks on 11 September 2001 in New York, lowered the demand for oil and decreased the oil price. As a response, the OPEC pushed beyond a fourth-Cut and sought support from other countries (Bleich et al, 2012). At the end of 2001 a corresponding alliance with Russia, Norway and Mexico was found. At this time the crude oil price had already dropped below 17-dollars per barrel. The following year started with fixed oil prices. This was supported by expectations of a recovering world economy. Since March 2002, the crude oil prices traded back within the desired OPEC range of 22 to 28-dollars per barrel. Therefore, the OPEC held its extremely low production rates. However, in the fall the oil flow rates were 10 to 15% above nominal rate.
2003 was marked by the Iraq war. Prior to the war the oil prices had risen considerably. With the outbreak of war prices fell but quickly returned to normal levels (Chevallier, 2012). At this time oil price speculation has already increased significantly and the anticipation of war had consequences for the oil market. The oil price rose. As the war developed relatively quickly and cleanly as expired and the damage to infrastructure were significantly lower than expected the oil price fell back to normal. In the second half of 2003 the oil inventories declined to a critically low level in the United States. Therefore, U.S. oil prices traded at a very high level. In Europe the strong Euro managed to balance the oil prices on a medium level.
2004 started with the lowest U.S. inventory numbers for crude oil. The refineries supplied at the lowest limit. Premature reduction measures initiated from the OPEC led to a sustainable rise of the oil price. Besides, the Iraqi oil supplies remained low because of continued acts of sabotage.
At the same time the world oil consumption rose much higher than expected. China developed a huge thirst for oil. This led to a rose of the GDP per capita in China. Furthermore, the trade worldwide increased significantly. That led to a higher demand on fuel. Therefore, the U.S. oil consumption rose to a record level. Through massive oil contract purchases funds and speculators pushed the crude oil prices up to new all-time record price of more than 50 dollars per barrel in October 2004.
The first half of 2005 showed that the oil prices were driven by stock market speculation. Funds and large investors juggled massively with oil contracts and pushed the barrel price up to a new all-time high. The days of cheap oil were declared irrecoverable. Therefore, $ 50 per barrel already had to be regarded as really cheap. The OPEC also actively supported this price level. Moreover, in August and September 2005 the hurricanes Katrina and Rita occurred - with devastating consequences for New Orleans and Louisiana and the oil platforms in the Gulf of Mexico. In the aftermath of the hurricane, however, a down-trend had been initiated until November (Chevallier, 2012). It came to a lower oil production in this region.
In the first half of 2006, the oil price was above $ 55 per barrel. Although the OPEC countries mainly produced in full capacity. The absence of major hurricanes and a calming of the situation in the Middle East and the Iran-conflict prevented fears of crude oil prices around $ 100 per barrel (Chevallier, 2012). Therefore, a more moderate oil price was found. However, the OPEC blocked a further drop in oil prices with a cut-decision. During the next year, a massive upward trend was shown. The historic mark of $ 100 for a barrel of crude oil pulled the mesmerized (Bleich et al, 2012).
The year began with recession worries especially for the U.S. economy. This led to a crash at the stock markets in mid-January. Investors fled from the dollar to the supposedly recession-proof oil. The record of 146-dollars per barrel was reached. At mid-year the trend tipped. The oil price bubble burst in the summer. The overpriced oil slowed the increasingly global economy. As a result an unprecedented down-trend in oil prices began. The oil prices fell back below the $ 100-mark with the crash of U.S. banks in September. In addition, the banking crisis also overtook Europe and Asia (Bleich et al, 2012). Worries about a global recession maintained the market and oil prices plummeted even further. From July to December, crude oil prices fell by 73 percent and stopped at 40 $ per barrel at the end of the year.
The aftermath of the recession after the banking crisis was the dominant issue for the oil market in 2009. Low demand coupled with strong high inventories in the U.S. kept the oil prices down. In the middle of the year the economic optimism prevailed. In the fall the oil prices climbed again to an average of $ 70 per barrel. China and India managed the crisis best (Bleich et al, 2012).
Three main themes dominated 2010. Firstly, the stimulation of the global economy after the banking crisis of 2008. Secondly, China as an economic engine. And thirdly, the state-indebtedness crisis in the EU (Chevallier, 2012). Greece and Ireland were saved from state bankruptcy by the European Community. This subsequently led to a significant downgrading of the euro against the U.S. dollar. Oil became more expensive for the EU. China shone as a world economic power and became a locomotive for the world economy (Gómez-Loscos et al, 2012). Moreover, China became the best market for EU exports and especially for the German economy. As a result, crude oil prices reached $ 90 per barrel.
The last year began dramatically. Riots and revolts dominated the Arabic world. The North African nations rebelled against the old established dynasty systems. In Egypt, Mubarak was finally chased out of office. The spark jumped over to Libya. Gaddafi, whose military remained loyal to him fought many months of war against his own people. Finally, Libya liberated itself.
In March a huge earthquake with a century-tsunami occurred on Japan's shores. The nuclear reactor in Fukushima ran into an unstoppable meltdown. A lot of nations began to rethink nuclear energy. Basically, Nations begun to look for other energy resources. However, this had negative consequences for the oil price. Because the devastating catastrophe in Japan influenced the world economy in general – oil price fall (Chevallier, 2012).
After all, the world economy runs well with China and Germany as economic locomotives. So that the oil price did not decrease.
In the summer the EU debt crisis dominated the EU policy. The euro rescue plan and the IMF had to save Greece from state insolvency. Likewise, Portugal, Spain and Italy were downgraded by rating agencies. Also the U.S. had to screw up their debt limit again. In the fall, fears of a recession intensified and the global share markets buckled.
Recession:
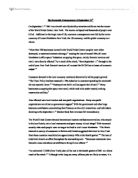
James D. Hamilton (1983) examined the relationship between the observed fluctuations in oil prices and their possible impact on the overall economy. He noted that a dramatic oil price rise is preceded in seven out of eight recessions in the U.S. (Hamilton, 1983, p. 245). The result in plotting the starting times of U.S. recessions in a diagram with the development of real crude oil price is interesting: All five recessions of the observed period fall coincided with a major increase of the oil price .
Real price of U.S. crude oil imports and recessions (1971 – 2003)
Barsky and Kilian (2004, p. ??)
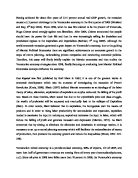
As a result of a comparison of the oil price development and the CPI Inflation dependence between these two variables may be recognised. The two graphs are not perfectly synchronised. Nevertheless, the positive correlation is evident. The latest development supposed a decrease of this correlation. The rapid rise in oil prices since 2002 was not related with a significantly higher inflation. The rate of inflation increased only moderate instead.
Real oil price (1970 = 100) and CPI inflation
Blanchard and Gali (2007, p.11)
V. Conclusion
The developed countries are depending on oil producing countries. The oil is a significant factor for the output of a nation in general. After all, it is important to handle nature catastrophes, international affairs and speculations in the right way, to maintain a relatively stable oil price.
VI. References
Barsky, Robert B. and Lutz Kilian. "Oil and The Macroeconomy Since The 1970s," Journal of Economic Perspectives, 2004, v18, 115-134.
Bernanke, B.S., 1980, “Irreversibility, uncertainty, and cyclical investment“, NBER Working Paper Series, No. 502.
Bernanke, B.S., Gertler, M., Watson, M., 1997, “Systematic monetary policy and the effects of oil price shocks”, Brookings papers on economic activity, 1997, 1, pp. 91-157.
Blanchard, O.J., Gali, J., 2007, “The macroeconomic effects of oil shocks: why are the 2000s so different from the 1970s?”, NBER working paper series, 13368.
Bleich, D., Fendel, R., & Rülke, J. 2012, 'Monetary policy and oil price expectations', Applied Economics Letters, 19, 10, pp. 969-973.
Begg, D. (2009) Foundations of Economics (4th Edition), McGraw-Hill, London
Brooks, I. (2009) Organisational Behaviour (4th Edition), Prentice Hall, Financial Times, Harlow.
Brown, S.P.A., Yücel, M. K., Thompson, J., 2003, “Business Cycles: The Role of Energy Prices”, Federal Reserve Bank of Dallas, Research Department, 0304.
Browne, F., Cronin, D., 2007, “Commodity prices, money and inflation”, ECB Working Paper Series, 738.
Butler, M. and Rose, E. (2011) Introduction to Organisational Behaviour (1st Edition), London, CIPD.
Campolmi, A., 2008, “Oil price shocks: demand vs. supply in a two-country model”, MNB working papers, 2008, 5.
Chevallier, J. 2012, 'Time-varying correlations in oil, gas and CO 2 prices: an application using BEKK, CCC and DCC-MGARCH models', Applied Economics, 44, 32, pp. 4257-4274.
Gómez-Loscos, A., Gadea, M, & Montañés, A. 2012, 'Economic growth, inflation and oil shocks: are the 1970s coming back?'.
Hamilton, J.D., 1983, “Oil and the macro economy since World War II“, The Journal of Political Economy, vol. 91, 2, pp. 228-248.
Hamilton, J.D., 1985, “Historical causes of post-war oil shocks and recessions“, The Energy Journal, vol. 50, no. 1, pp. 97-116.
Huntington, H.G., 1998, „Crude Oil Prices and U.S. Economic Performance: Where Does the Asymmetry Reside?”, The Energy Journal, vol. 19, 4, pp. 107-132.
Jiménez-Rodriguez, R., Sánchez, M., 2004, “Oil price shocks and real GDP growth : empirical evidence for some OECD countries”, Applied economics, vol. 37, 2, pp. 201-228.
Lescaroux, F., Mignon, V., 2008, “On the influence of oil prices on economic activity and other macroeconomic and financial variables”, Centre d'Etudes Prospectives et d'Informations Internationales, <http://www.cepii.fr/anglaisgraph/workpap/pdf/2008/redirect/wp200805.htm>.
Ricky, W. Griffin and Ronald, J. Ebert (2006) Business (8th Edition) Upper Saddle River, N.J. Pearson Prentice Hall.
Rogoff, “Globalization and Global Disinflation,” in Federal Reserve Bank of Kansas City, Monetary Policy and Uncertainty: Adapting to a Changing Economy, 2004.
Steven, L. Wartick and Donna, J. Wood (1998), International business and society, Oxford Blackwell Business.