Introduction
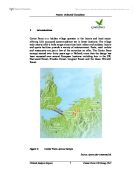
Center Parcs is a holiday village operator in the leisure and hotel sector offering fully equipped accommodation set in forest locations. The village style resorts offer a wide range of activities both indoor and outdoor; leisure and sports facilities provide a variety of entertainment. Pools, retail outlets and restaurants are just a few of the amenities on offer. The Center Parcs concept started over thirty years ago in Holland, since then the design has been recreated over several European locations including four in the UK, Sherwood Forest, Elveden Forest, Longleat Forest and the Oasis Whinfell Forest.
Figure 1: Center Parcs across Europe
Source: cparcs.star-command.de
.1 History and Formation
The founder of the CP concept Piet Derksen sold the majority of his shares in 1989, to Scottish and Newcastle in order for him to concentrate on the development of the parks themselves. S & N took complete ownership of CP in 1991 to expand their leisure market, in addition to this S & N owned the holiday camp Pontins.
Later in 2001 S & N sold Pontins along with Center Parcs, this move was to concentrate on brewing. In addition to the sale of the holiday villages, S & N also sold their public houses. In the meantime CP continued to expand across Europe; these sites can be seen in Figure 1.
DB Partners a German bank and Pierre and Vacances a French Holiday Company bought CP from Scottish and Newcastle in a fifty-fifty partnership for €670 million. This entailed DB Partners owning the UK centres whilst Pierre and Vacances owned the European Centres, at this stage the group is taken off the stock market. This was due to the company restructuring and the internal assets being sold.
Figure 2 Recent Timeline
Center Parcs UK Group PLC and Center Parcs Europe are now completely separate companies. Center Parcs UK Group PLC remains the focus of this report.
Please see Appendix A for a detailed timeline if required.
One of the most significant processes in the company's development took place in 2002 when the property assets of the British holiday Centres were sold off. The assets were sold off for £465 million and are leased back to the Group for 15-18 years; this progress has increased the company's capital dramatically allowing development and investment.
However it could be cause for concern for the shareholders and the company's interests now those main assets have been sold. This process involved high risk, as the company now have fewer options if funding needs to be generated quickly.
2 About Company
2.1 Financial analysis - Stock exchange performance
Whilst Scottish and Newcastle retained ownership the company floated on the stock market during this period the performance was high until 2000 when levels peaked and troughed frequently. However in 2001 CP was taken off the market as the company was restructured. Please see Appendix B for graphical representation if required.
The company was floated on the stock market again in December 2003. At first shares were posted at £1.00 since then they have reached a record low of 76p. The share values are ...
This is a preview of the whole essay
2 About Company
2.1 Financial analysis - Stock exchange performance
Whilst Scottish and Newcastle retained ownership the company floated on the stock market during this period the performance was high until 2000 when levels peaked and troughed frequently. However in 2001 CP was taken off the market as the company was restructured. Please see Appendix B for graphical representation if required.
The company was floated on the stock market again in December 2003. At first shares were posted at £1.00 since then they have reached a record low of 76p. The share values are currently decreasing and increasing quite rapidly and are currently climbing again to 89p. Please see Appendix B for more detailed shares information if required.
Investment analysts recommend that current investors should not sell shares in Center Parcs but they are a strong buy or at least a hold. There were no recommendations from brokers to sell or strongly sell. Forecast estimates suggest that earnings per share will increase in 2005 and the following year.
2.2 Organisational Structure
At present the company is made up of both Executive and Non-executive Directors, the executive directors have been with the company many years:
Executive Directors Non-Executive Directors
Martin Robinson - 1994 John Matthews
Martin Dalby - 1978 David Mace
Simon Lane - 2002 Gita North
Figure 3 Board of Directors
Source Center Parcs (online 2004)
Obvious benefits arise from this, as the non-executive directors provide external and objective advice since the company does not influence them. The company is split into departments providing a clear formal structure, the operation of the holiday villages are split into similar defined managerial departments. This can be described as a flattened hierarchical structure, a diagram supporting this can be found in Appendix C. This provides good communication between managers, as the operating board provides suggestions to the management of each of the four holiday villages, which they can then implement in the operational system.
2.2.1 Staffing
Number of employees: approximately 4,000 (full-time & part-time)
Considering there are only four holiday villages 1000 staff members per village does appear to represent high staffing levels. This can incur high operating costs for the company, wage bill, training etc are a costly resource.
Moreover this may be the reason that Center Parcs is so successful, with this high proportion of staff, Customer Service could prove to be implemented easily, and thus providing improved service quality. This could be the basis for CP strong brand awareness and reputation.
2.3 Ownership and Control
Today the major shareholders of Center Parcs (UK) Group PLC as of November 2004 are as follows:
F & C Management 14.12%
Threadneedle Investment Managers 5.30%
Other Directors 1.69%
Figure 4 Major Shareholders
Source: Center Parcs (online 2004)
F & C Management and Threadneedle Investment Managers have a more than 3% share, which provides them with an underlying function/voice within the company. This could prove to be a problem for Center Parcs as shareholders general interests are usually profit driven and this may interfere with any of the processes that general management may wish to implement.
3 Performance Indicators
3.1 Center Parcs Own Targets
Figure 5 Occupancy Targets
Figure 5b Occupancy from 1997
Source: Center Parcs (online 2004)
Figure 5c Increase in Repeat Bookings
Figure 5d Increase in On-site Spend
Figure 5e Customer feedback
Figure 5f Expansion target
3.2 Market Segmentation:
The growth in the ABC1s market indicates growth for Center Parcs who target higher socio-economic groups as the customer base. Note: Figure 4.
998
2000
2002
2004
2006
% change
2002-06
AB
9,783
0,643
1,366
2,229
3,002
+32.9
C1
3,003
2,910
3,222
3,538
3,886
+6.8
C2
0,316
0,398
9,973
9,715
9,386
-9.0
D
8,446
8,397
8,482
8,343
8,302
-1.7
E
5,508
5,103
4,964
4,680
4,457
-19.1
Total
47,056
47,451
48,007
48,506
49,033
4.2
Figure 6: UK population, by socio-economic group, 1998-2006
Source: National Statistics 2002/Mintel
Mintel (online 2004) suggests the shift towards holidays in the upmarket forest village centres clearly had an effect on increasing prices during the 1990s, particularly after the fourth such centre (Oasis) opened in 1999.
3.2.1 Seasonality:
With the introduction of the business market mid-week occupancy remains competitive to that of the weekends. This maintains overall occupancy, ensuring that the Group can remain investing in the development of the holiday villages; thus maintaining future investment and funding with a high market share.
3.3 Constraint and contingency Management
4 Industry structure analysis
4.1 Product Development
Center Parcs is constantly rejuvenating its product range to maintain its strong position in the Product Life Cycle note: Figure 7
Figure 7: Interpretation of Center Parcs stage in the Product Life Cycle
This interpretation of the Groups' stage in the PLC indicates that while the company is a mature organisation it has the opportunity to rejuvenate itself for the foreseeable future. There are factors that influence this process, CP has the ability to grow organically and continue rejuvenation because the Group have majority market share due to the unique forest location of the villages and the potential for new entrants to the market is close to impossible. The barrier for new entrants to the market is high due to the initial funding and planning permission constraints.
4.1.1 Dynamic Response
To analyse the company's' dynamic response to changing consumer needs the Ansoff Matrix has been used, to show the performance of CP regarding the company's product development.
Present products New Products
Market Penetration
o The expansion of the accommodation stock by 4%
o The capital expansion programme which aims to develop the fifth CP site
Product Development
o Improvement of central facilities
- Spa treatment rooms for Aqua Sana, restaurant diversity, sweet shop and sport shop.
Market Development
o Introduced the conference market that increases mid-week occupancy as it attracts the business market
Diversification
o Conferencing
o Spa's
o Center Parcs now attracts the short break market and has moved away from the longer break market
Figure 7a: Center Parcs Product development in the form of the Ansoff Matrix
The group's dynamic response is positive; this could assist in ensuring that Center Parcs maintains its strong brand image. In addition to this during the year, the Group have re-designed and re-launched its website to make it easier for guests to book on-line. As a result of this, on-line bookings have increased from 7% to 12% of total bookings. All these improvements could sustain CP future success.
4.2 Competitive position
Porter argues that businesses must respond to competitive forces:
Force 1
Force 2
Force 3
UK
Continent
Villages
3
0
Villas/apartments
3,142
Guests (annual)
.2m
3.2m
Overnights
4.8m
3.7m
Turnover
£166m
€500m
Staff
4,000
0,000
% stays:
3-4 nights
86
77
5+
4
23
Figure 8: This shows the comparison between CP UK and CP Europe, possibly CP UK closest competitor and existing rival.
Source: Center Parcs websites
Although Figure 8 is slightly dated it shows a strong turnover figure for the company compared to its European rival. Center Parcs Europe has a larger capacity yet turnover is approximately double that of CP UK. This implies that occupancy and visitor spending is greater in CP UK compared to CP Europe.
Porter also suggests that there are three strategies to overcome these forces - Center Parcs process of response is as follows in Figure 8a:
Figure 8a: Response process for competitive position
This process places CP in a strong unique position in the market, a strategy which provides the Group with a competitive advantage. To follow this, CP may be more attractive than their UK competitors due to their strong environmental management, for which they have received recognition awards and strong sustainable reputation.
5. Closing Statement:
To sum up earlier analysis the consultancy recognises the company is choosing to grow organically thus providing low-risk development, this could maintain a viable long-term future for the company if development occurs as planned and forecast. The company has established much strength for itself as recognised in the SWOT analysis note Appendix D.
Once the fifth site is in operation, there will be more capacity to improve on targets such as turnover, repeat bookings etc. With no direct competitors and five sites this will provide the Group with a whole market segment, this will further strengthen CP position and benefit share value.
Bibliography
Financial Times online 2004. Available from:
http://www.ft.com
FONT, X & TRIBE, J., 2000. Forest Tourism and Recreation case studies in environmental management. CABI Publishing: Wallingford.
Hemscott online 2004. Available from:
http://www.hemscott.net
Money Extra online 2004. Available from:
http://www.moneyextra.com
MOUTHINO, L., 2000. Strategic Management in Tourism. CABI Publishing: Wallingford.
PORTER, M.E., 1998. On Competition. Harvard Business Press: Boston.
PORTER, M.E., 1985. Competitive Advantage creating and sustaining superior performance. Free Press: New York.
Reuters online 2004. Available from:
http://www.reuters.co.uk
Travel mole online 2004. Available from:
http://www.travelmole.com
TRIBE, J., 1997. Corporate Strategy for Tourism. International Thomson Business Press: London.
Yahoo finance online 2004. Available from: http://www.uk.finance.yahoo.com
References
Center Parcs Online 2004. Available from:
http://www.centerparcs.co.uk/home
Mintel online 2004 Available from:
http://www.reports.mintel.com/sinatra
Futures Unlimited Consultants
Critical Analysis Report Center Parcs UK Group PLC