From the service marketing perspective, the way to retain customers is to improve customer service quality and satisfaction (Berry and Parasuraman, 1991; Zeithaml and Bitner, 1996, p. 176). In a related study, Ennew and Binks (1996) examined the links between customer retention/defection and service quality in the context of relationships between banks and their small business customers in the UK. Their findings support the hypothesis that retention is influenced by service quality, in terms of both functional and technical, and customer relationships. They also found that trust in customer-banks relationships has the largest impact on potential defection, followed by general product features. The investigation, however, did not provide indications of the financial impacts retention had on the banks' profitability and it is implied to refer to branch-based banking where customers' expectations on relationships are likely to be greater than telephone or Internet banking.
From the industrial marketing perspective, the way to retain customers is by forging multi-level bonds comprising financial, social and structural bonds. Turnbull and Wilson (1989) examined, through a case study, the potential benefits of protecting profitable customer relationships through not just social, but also structural bonds in the context of industrial marketing. Social bonds, according to Turnbull and Wilson, refer to positive interpersonal relationships between the buyer and seller. Although they did not provide an explicit definition of structural bonds they implied, through their illustrations, that structural bonds refer to relationships that are built upon joint investments that cannot be retrieved when the relationship ends. This may be due to the complexity of the relationships and the cost of changing to another supplier. In terms of training of technicians, for example, a switch to another type of machine would require total retraining of these technicians. Structural bonds, therefore, had helped create value to the customers by saving the costs of retraining or making a new investment with a new supplier.
From the 3PL industry perspective, however, not much related study has been conducted on the way of retaining customers. First of all, 3PL companies are service providers. In this sense, they have the same characteristics as in other service industries, such as banking and airline. The retention rate can be increase by improving service quality and customer satisfaction. At the same time, the retention rate can also be increased by forging multi-level bonds (such as developing joint ventures) or developing deeper relationship. Further empirical works carried out thus far were attempts to study and model the mechanics of customer retention, in terms of its potential cause and effects of customer retention to companies (Page et al., 1996; Payne and Frow, 1997). Page et al. (1996), in their retrospective study, investigate the relationship between customer's age or tenure and customer's contribution and the firm's market share in an industrial marketing context. If we combine all the opinions of current researches on customer retention, we can conclude that customer retention is subjected to the following factors: customer age (or life cycle), relationship depth, satisfaction, price sensitivity and competition environment. The mathematics form for the relationships is: Customer Retention (CR)=f (customer life cycle, relationship depth, satisfaction, price sensitivity, competition environment) Among the five factors, four of them (customer life cycle, relationship depth, price sensitivity, competition environment) are very objective or hard to change by the vendor. But 3PL companies still can do something to improve customer satisfaction and thus increase the retention level.
Sales automation or complaints handling automation?
Overview
In most successful cases of CRM implementation, companies started their implementation with sales automation. A typical example is Dell Company, well known for pioneering the “direct sales” mode. Dell designs a personal style web that can provides an intensive communication between customers and Dell. With the support of strong back database, customers can better realize self-service via website. On the other hand Dell can collect customer feedback and purchase behavior information on web too, which can help better understand customer needs. Most of the sales processes are automated. As a result, the order cycle time is shortened tremendously and order process accuracy is increased. Customers are satisfied with the kind of service provided. But the success in Dell cannot be automatically transferred to other industry. In this chapter, a comparison between Dell and 3PL companies in terms of business characteristic is conducted. The similarity and difference are listed. Based on the comparison, we propose that 3PL companies should invest in complaints handling automation rather than sales automation as the first step of CRM implementation. To support the argument, we introduced NAV calculation model in the end of the chapter.
Business character comparison
If we want to decide whether sales automation in CRM should be the central focus in 3PL industry just as that in manufacturing industry, we should first understand the similarity and difference between the two industries. Therefore we conduct a thorough comparison in terms of business characters, focus on three aspects: customer base, product features and relationship respectively. (See table3-1)
First of all, let us compare the customer base between Dell and 3PL companies. A 3PL company usually has companies only as its customers rather than an individual. But to dell, it can sell PC to an individual and on the other hand, it can sell PCs to a company, like Johnson & Johnson, to equip its IT department. So Dell can have either company customers or individual customer.
Table 31 Comparison of business character between Dell and 3PL companies
Secondly, Dell’s customers can be located at any corner of the world as long as they can log onto Dell’s website. But a 3PL’s customers are usually located within some area. The reason is that all services provided by 3PL companies are based on some physical facilities, such as warehouses and lorries. For example, suppose there is a Singapore based 3PL company and all its warehouses and lorries are located at Singapore. Only those companies who are also located at Singapore may potentially be the 3PL’s customers. In other word, it is hard to image that a European company located thousands of miles away will use the warehouse in Singapore unless the European company has a Singapore branch. Therefore, a 3PL’s business is strictly limited within some areas.
Thirdly, it is easier for Dell to segment its customers. The only criterion of the segmentation is how many PCs a customer has bought annually. The more PCs a customer has bought, the more profitable customer he is regarded. But the case in the 3PL industry will never be so simple. Here is an example, suppose there are two customers, A and B. Customer A wants to rent the whole warehouse for half a year but customer B wants to rent half of the warehouse for a year. Assuming that the rental rate is the same to both customers, which one is more profitable to the 3PL company? The answer is “it depends”. Sometimes customer A is more profitable while sometimes customer B is more profitable. Customer A makes the warehouse full utilized for half a year. But in the second half year, if no new customer comes in, then the warehouse will be totally empty and generate no revenue but cost. On the other hand, customer B can generate revenue for the warehouse for a whole year and during the year some other customers can also rent the other half space of the warehouse and thus bring more revenues. In that case, you may consider customer B as more profitable. But in some cases, it is on the contrary. The existing of customer B will sometimes make the company lose some big customers. Suppose customer B has rent half of the warehouse for a year and then another customer C wants to rent the whole warehouse for a year. But because of the occupancy of customer B, the company cannot meet customer C’s requirement and thus lose a big deal. The dilemma is because the service of a 3PL company is always constrained by its capacity, thus should take capacity issues into highly account. But Dell seldom considers its manufacturing capacity as a problem. Another issue that makes the segmentation more complex for a 3PL company is the backhaul problem. Suppose a customer want to book a truck to deliver something from point A to point B. He will only pay for the trip from point A to point B. But the truck still has to come back from point B to point A. This backhaul cost is not covered by the customer payment. So a 3PL company must try to arrange another deal on the way from point B to point A otherwise the cost on the backhaul can bring back nothing. Another customer has something to deliver from B to A but he is only willing to pay half of the price. In that case, it is hard to determine the value of that customer. On the one hand, he contributes only half of the normal customers but cost the same. On the other hand, he contributes the extra revenue which originally expected to be loss. Too many variables make it hard for a 3PL company to segment its customer properly.
The next aspect we are going to compare is the product. The product of Dell is obviously the PC. It is tangible that people can easily tell whether the product is good or not before you buy it. But the product of a 3PL is quite different. The product offered by 3PL companies is intangible service. You rent some space from a 3PL company’s warehouse and let him take care of your goods or you let 3PL deliver something for you at some time. All these are the products they offer you. Unlike those physical PCs, you can hardly tell whether a service is good or not before you buy and experience such kind of service. In addition, if one is not satisfied with Dell’s PC, he can easily terminate the relationship, deciding not to buy a Dell Pc any more. All his loss is just the PC that has been bought. He may choose another brand of PC immediately. But a customer of a 3PL company will be more cautious because once a customer is going to outsource his logistics to a 3PL company, both sides usually sign a contract which lasts at least 1 year. Also, some surveys indicate that most companies usually outsource their logistics to only one 3PL company which means if the service provided by the 3PL cannot meet the requirement, the customer’s logistics work will crash at all. Compared with the relationship between Dell and its customer, the relationship between a 3PL and its customer is bonded and hard to shift within a long period. In that reason, it usually takes long and more effort for a company to decide to whom it should outsource its logistics work than to decide from whom it should buy some PCs.
The cost structure of two kinds of products is totally different. At Dell side, total cost of serving a customer should include marketing cost, product cost, delivery cost and after-sales support cost. Marketing cost refers to the cost spent on the advertisement in order to attract the customers. After-sales support cost refers to the repair cost and free technique support cost. We can assume that Dell pays the same marketing cost and support cost to each of its customer. The product cost is linearly associated with the volume of product purchased and the delivery cost is also associated with the volume in some extent. So the total cost of serving a customer is only affected by the volume he purchase. The cost structure is simple and easy to understand. But the cost structure of a 3PL company is not as simple as Dell’s. The cost is usually decided by some other factors besides volume. Suppose a customer has outsourced its warehouse to a 3PL company and ships goods from the 3PL’s warehouse. The total volume of goods is fixed every month. If the customer wants 2 pallets of goods once, then it will take the 3PL company 3 times to ship those demand goods every month. But if the customer can demand 3 pallets once, then it will only take the 3PL twice to ship demand goods. As we know, it takes a 3PL company almost the same cost to ship 2 pallets or 3 pallets. But different arrangements can affect the ship times thus change the total cost. Obviously, shipping 3 pallets once will save the 3PL’s handling cost by 33%. Now we can see that although the volume of service purchased by the customer is same, the cost of serving a customer will be different.
Dell has been equipped with many automation tools, such as auto sales, auto technique support and auto call center, etc. It is possible for Dell’s customer to buy a PC without human interaction. The same case cannot happen in 3PL industry currently. Though being equipped with AS/RS (Auto Storage and Retrieve System), 3PL industry currently is still a human intensive industry. Most of the logistics process cannot be realized without human interaction. For example, it is the human that can drive a truck and deliver the ordered goods to customers. The impression of a 3PL company to its customer is not from the website but mostly from the driver. Therefore, it is very important to train the people, especially the drivers to be more customer-oriented instead of implementing automation everywhere for all the 3PL companies.
The last item in the product aspect we are going to compare is the quality control. Quality can have two dimensions of meanings, actually quality and perceived quality. (Professor Jacques Horovitz, “The seven secrets of service strategy”, Prentice Hall, 2000) Actually quality is the real quality that a company delivers while perceived quality is the quality that a customer perceives. Usually actual quality differs from perceived quality. This phenomenon is more obvious in 3PL industry, which belongs to service industry, than in manufacturing industry. Many studies have been conducted to improve the quality of production while less efficient ways have been found out to improve the quality of service. Why? It is because the automation of production that each tiny process can be monitored and controlled by computers precisely. But in an industry full of human involvement like 3PL industry, the quality is hard to control because the uncertainty of human beings is hard to predict. Besides, some other factors such as weather can also affect the service quality dramatically. For example, a delivery is delayed because the delivering truck is blocked by a big storm.
The third aspect we are going to compare is customer satisfaction. A survey conducted by Dr. Edward H. Frazelle in 2001 revealed that the customer satisfaction has three levels. The first level of satisfaction relies on the performance of a company’s core business; the second level relies on the support service and the highest level of the customer satisfaction relies on the emotional factor. Table 3-2 has listed all the three levels of satisfaction between Dell and a 3PL company.
As we can see in the table, in PC manufacturers, like Dell, the core business is of course the PC itself. If they can provide a good performance PC at a reasonable price, then customers will be
Table 32 Indicators of three satisfaction levels in Dell and 3PL companies
satisfied. Here the good performance means both high speed and reliability. Most PC manufacturers can reach the expectation in this level now, thus it is hard to distinguish between all the competitors in this level currently. Competition has moved to the second satisfaction level—support service, which includes both pre-sales and after-sales service, easy order and on-time delivery. It has been a key battlefield for all of the PC manufacturers. Some big players have invested a lot on building a sophisticated IT system, trying to raise the customer satisfaction and win more market share. As a leader in PC manufacturing industry, Dell has been outstanding in the second level and steps forward to the emotional level. Dell can help customers optimize the PC configuration, achieving the maximum benefits at the minimum cost for customers. As long as a customer keys in his requirement, including the expecting function, total budget and other constraints, Dell can immediately propose an optimized purchasing plan to the customer. Also, Dell can figure out the total savings on the optimized plan, giving a clear picture of ROI. By doing so, all the customers realize that Dell is striving for creating values for them. Such an emotional satisfaction is very important to establish the long-term relationship with customers. But in 3PL industry, the key performance indicator still lies on the core business level, which includes warehouse capacity, transportation ability, etc. Big 3PL companies have lots of cash to book in enough capacity thus can fulfill more orders and promise its delivery time. The small players cannot guarantee their customer’s delivery time but they are much cheaper. In this sense, CRM is more adapted to those big 3PL companies because their customers are less price-sensitive and have more potential demand on the support service and emotional satisfaction.
Quality measurements comparison
Dell is a representative of manufacturing industry while 3PL companies belong to service industry. The industry category difference decides the different measurement in quality issues. Those manufacturers, such as Dell, pay more attention to actual quality while 3PL companies put more emphasis on customer perceived quality. The gap between actual quality and perceived quality (listed in table3-3) makes quality control more difficult for 3PL companies than for manufacturing companies, which urges 3PL companies to shrink the gap as much as possible.
Table 33 Comparison of Quality control between Dell and 3PL companies
Customer complaints handling automation in 3PL companies
Based on above comparisons, we noticed that sales automation plays a less important role in 3PL industry than in manufacturing industry. In manufacturing industry, what both manufacturers and their customers concerns about is the product. Manufacturers are concerned about how many products they can sell annually. Customers are concerned about whether the product is in good quality and when can they get the products. They communicate with each other through sales sector. Each sales agent deals with hundreds of customers and hundreds of product SKUs. Such a large quantity of information makes sales sector become the bottleneck of the whole business process. Further more, long order process cycle time and low process efficiency damage the customer satisfaction. In that case, sales automation can release most workload of sales agents. It can help to shorten order process time and increase efficiency. The investment in sales automation system can be justified by the increased sales opportunities and customer satisfaction. In 3PL industry however, customer satisfaction is mostly associated with service quality, which consists of logistics service quality and support service quality. As a major part of support service, customer complaint handling becomes one of the key measurements of service quality. Both response time and efficiency can affect customer satisfaction significantly. In addition, the response of complaints can affect the logistics service quality as well. If 3PL companies can make use of those complaints and make improvements accordingly, then the logistics service quality can be improved. Unlike manufacturers who can justify the investment in sales automation by increased sales opportunity, 3PL companies should justify the investment by customer retention rate. The increased or decreased retention rate can directly affect the profitability.
Links between customer retention and profitability
Customer complaint handling is so important that it is linked with customer satisfaction. Customer satisfaction is also linked with customer retention (Kaj Storbacka, Tore Strandvik, Christian Grönroos, 1994). The concept of customer retention is appealing because, unlike relationship marketing and service quality initiatives, improvements in retention can be correlated to an increase in profitability (Reichheld and Sasser, 1990). Now we are interested in the relationship between customer retention and profitability. If our assumption that the increase of customer retention can also increase the profitability is true, then the investment in customer complaint handling system is justified by ROI.
Suppose that YCH keep its customer retention rate at x%. That is, each year x% of the existing customers of YCH will continue to be its customers and 1-x% of the existing customers will terminate the contracts with YCH. Due to the capacity restriction, we assume that the number of customer served in YCH remains stable each year, which indicates that once X number of customers leave, then X number of new customers will come to take place. The assumption is also to prevent that the profit is changed by the increase or decrease of the customer number. Let A denote to the total customer number each year. Let r denote to the average annual revenue contribution of each customer. In the meanwhile, r is a function of t, which is regarded as a time variable. According to the statistics of finance report of YCH, function r(t) can be looked on as a discrete function of time t, whose expression is described as follows:
We assume that the company has to spend to keep all customers (including those new prospecting customers) and spend to prospect new customers. is a function of t. In addition, is always equal to. To make the problem easy to study, we assume that no other costs occur to affect the profits. Let’s denote P to the profits of YCH and i to the annual interest rate. All the variables and parameters are summarized as follows:
P—profits
A—total customer number
x—customer retention rate
r(t)—average annual revenue contribution of a customer during t year
--average annual cost of keeping a customer
--average cost of prospecting a new customer
i—annual interest rate
First of all, we want to investigate the revenue of cost generation of those customers, who entered YCH now, represented by time slot 0.
Revenue
Cost
Similarly, we now calculate the revenue and cost generation of those customers, who entered the company in year 1.
Revenue
Cost
For those customers entered the company in year 2
Revenue
Cost
…………
After we derive the formula for those customers who entered the company in year 3, year 4 and so on respectively, we find that the revenue and cost generation are all the same except for the year in which the revenue and cost generated. We are interested in the Net Asset Value (NAV) of the continuous company profit stream. We use represents the NAV of the total profits from those customers who entered the company in year n. And we also know:
For the customers who entered the company in year 0
=
=
For the customers who entered the company in year 1
=
=
For the customers who entered the company in year 2
=….
=
After we calculate and , we find that
when
(This Formula can be proven by mathematics induction method, detail of proof in Appendix D)
+
After modeling the relationship between customer retention rate and company profitability, we are going to apply the data collected from YCH into the model to see the quantitive results. The retention cost refers to the operation cost, customer service (major in the building and maintaining customer handling system) cost, employee training system and other administration cost. The cost of acquiring a new customer includes sales agents’ salary, bonus, telecommunication cost, visit cost and all kinds advertisements cost. The interest rate is according to DBS deposit rate. All parameters are as follows:
A=20
r=2800000
r(1)=0.3r=840000
r(2)=0.7r=1960000
=60000
=1.25%
After plugging in the data collected from YCH, the NAV with retention rate 100% is
(S$)
Before YCH implemented CRM, the retention rate is 90%, then
(According to appendix E)
The estimated annual cost of complaint handling system is 500000, then
Benefits of CRM—satisfied customers
Overview
One of the major benefits of CRM is increased customer satisfaction. To find out whether customer satisfaction is increased after CRM implementation, we conducted a survey among 15 key customers in YCH. Some of them have been implemented customer complaints handling automation while some others haven’t. By comparing the response time, response efficiency and satisfaction level of two groups of customers, we can conclude whether the complaints handling automation system can increase customer satisfaction level.
External survey
The target respondents of the survey are major customers of YCH. The survey has 2 major purposes. 1. Investigate customer satisfaction level. 2. Figure out leaving barrier for each customer. As mentioned before, overall customer satisfaction depends on two issues: one is customer measurement on logistics service performance and the other one is measurement on support service performance. In this survey, we both listed the logistics service performance measurement and support service performance measurement. A 3-point scale is employed to measure and quantify the survey results. For the investigation on leaving barrier, we listed 5 major indicators:
- Customer life cycle
- Business coverage (The ratio of logistics work that outsource to YCH to total logistics work needed)
- Performance measures
- Price sensitivity
- Competitors
Each customer has its own life cycle, from acquisition, retention to declination. Generally, the average life cycle for a 3PL customer is 5 to 6 years. So it is divided into 3 periods equally, say first 2 years is on the acquisition stage, next 2 years is on the retention stage and the last 2 years is on the declination stage. A special case is that if a customer has spent more than 5 years in one 3PL company, then it most possibly will stay longer. In summary, the customer with staying less than 2 years or the customer more than 5 years are supposed to stay within the company longest, thus get the highest score, 3 points. Customers with 2—3 years, 2 points and customers with 3—5 years, 1 point. The higher the point is, the more likely that the customer will stay longer.
Business coverage is the ratio of the total demand of a customer and his actual purchase from a supplier. To the 3PL company, the ratio is the total logistics demand of a customer and the actual logistics service he purchases from a 3PL. It is another indicator of the mutual relationship. The higher the coverage ratio is, the more reliable the relationship is. Therefore investigation on the ratio can reflect the relationship. If the coverage ratio is 100%, which means the current relationship is very healthy and the customer is very unlikely to leave. 3 points are given. The 66% ratio indicates a average relationship status, thus 2 points are given and lastly with ratio of 33% or less are given 1 point.
Whether customers are willing to build the relationship with a supplier depends on the satisfaction on the service performance. Therefore the measurement of the performance can also indicator the relationship status. The performance indicator is divided into 9 sub indicators, each of which represents the performance of one kind of logistics service provided by YCH. The higher points indicate a better performance. 3 points indicate a “Good” performance; 2 points indicate a “Average” performance and 1 point indicates a “Poor” performance. The comprehensive performance indicator depends on the average of the 9 sub indicators.
Price sensitivity is another indicator of the relationship status. If a customer is very price sensitivity, then the relationship is vulnerable once the price fluctuates. Therefore the relationship status can be reflected by the current customer attitudes. A price sensitive customer always thinks the price is too high. Once he finds a lower price somewhere, the customer will leave soon. The relationship indicator is given 1 point if so. Unlike those price sensitive customers, some pay more attention to the ratio of price and quality. They are the groups who are willing to pay more for better quality in reasonable ranges. The attitude—the price is worthwhile reflects a potential longer relationship, thus should be given 3 points. The attitude—the price is acceptable reflects a middle situation, thus should be given 2 points.
Finally, we consider the competition indicator. Sometimes the reason for customer loss is not because your performance is bad but because your competitors’ performance is better. Thus whether the relationship status is good also depends on what kind of competition is faced. Basically, the more vendors a customer has for a type of service, the more intensive the competition will be because the customer can easily compare the price and quality between vendors and ask for a price discount. So if a customer only has one 3PL, the competition is supposed to be easy and the relationship thus is most stable. The indicator is given 3 points. If a customer has three or more 3PL vendors, the competition is most tough and the relationship is most vulnerable. The indicator is given 1 point. If a customer has two vendors, the competition is middle and the indicator is given 2 points.
The comprehensive barrier for each customer can be obtained by summing to points of five indicators. A higher barrier points indicate a lower possibility of customer loss. If customer A gets higher marks than customer B does, then customer A is less likely to leave than customer B does. The 5 indicators represent the top five factors that affect customers’ retention. The higher marks a customer gets, the more satisfied a customer is with the five factors. Therefore we can measure customers’ retention risk by looking at the total marks customers get for the 5 indicators.
20 questionnaires were sent to customers by e-mail on Aug 20. The first batch of 2 came back on Aug 30. The second batch of 8 came back on Sep 15 and the last batch of 5 came back on Sep 22. Totally 15 out of 20 questionnaires were returned. The return rate is 75%. 15 customers equably spread among three business categories, which are chemicals, electronics and Fast-moving consuming goods (FMCG). We name the first customer from chemical group C1, the second customer from chemical group C2 and so on. We name the first customer from electronics group E1, the second E2 and so on. We name the first customer from FMCG F1, the second F2 and so on.
Complaints response time cycle
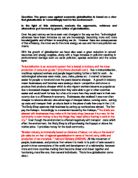
We have mentioned that overall satisfaction depends on two issues. One is satisfaction on support service performance. Customer complaint handling plays a major part in support service in logistics industry. Therefore, this section conducts a data analysis on the complaint handling system. One of the major measurements of complaints handling is average response time. The survey results showed that telephone and e-mail are two key channels for complaints before implementing CRM. The average response cycle time is about 30 days. The long response time of traditional way mostly attributes to the stunt of the information transmission. The agents need to handle so many complaints per day and sometimes they may make mistakes. Even they can record all the complaints accurately, the information still get lost sometimes when the agents transfer information to the operation staffs. There is only one cause for the delay—no one is monitoring and coordinating the process. This is the purpose of of the new complaint handling system features. The auto escalation function can monitor and coordinate all complaints handling automatically. If the first level users fail to give response within 1 workday after acknowledging customer complaints, the system will automatically escalate the problem to the sector header, who is the immediate boss of the first level user. The reason for setting escalating time is 1 working day is that the sector heads still have 1 working day to process the complaints within 3 days after receiving complaints. If the sector headers fail to acknowledge the solutions within 3 working days after receiving complaints, the system will then make the level-2 escalation to the department header, who is the boss of the sector heads. If the department headers still fail to acknowledge the solution within 5 working days after receiving complaints, then the system will make the level-3 escalation, also the final escalation, to the company boss. Because of the pyramid-like organization structure, such a escalation can not only make the best use of the all human resource but also respect customer complaints in the most extent. To investigate the response efficiency of the new system, we should figure out how many percentages of complaints are dealt with before the first level escalation, how many percentages before the second level escalation and the third level escalation. Figure 4-1 shows the statistics of the escalation for complaints. Due to the accessibility of the data, we just count the complaints from customer C2, C3 and C4. The total number of the complaints from the three customers is 70. The number of complaints from C2, C3 and C4 that have experienced the first level of escalation is 13,15,7 respectively. The total number is 35, which means the other 35 complaints from customer have been responded within 1 working day after receiving complaints. The number of complaints from C2, C3 and C4 that have experienced the second level of escalation is 6, 8, and 8 respectively. The total number is 22,
Figure 41 Auto escalation statistics
which means 48 complaints have been responded within 3 working days after receiving complaints. The number of complaints that have experienced the third level of escalation is 13 (C2, 5, C3, 3, C4, 5), which means 57 complaints have been responded within 5 working days after receiving complaints. Figure 4-2 shows the percentage of the complaints that is responded within 1, 3 and 5 working days. 49% of the complaints have been responded within 1 working day after receiving complaints. 19% of the complaints have been responded within 3 working days after receiving complaints and another 19% within 5 working days. The rest 13% of the complaints are handled during the month meeting with customers. If we ignore the 13% of the complaints that are handled during the meeting, the average response time for the 87% of the complaints is (day)
Figure 42 Statistics of the response time
Customer satisfaction level comparison
As we mentioned in section 3.4, customer satisfaction level in 3PL industry consists of logistics service quality and support service quality. Customer complaints play a major role in support service. So the response time of complaints handling decides the quality of support service. In section 4.3, we have compared the average response time before and after CRM implementation, which has been proven to be a great improvement. In this section, we want to compare the satisfaction on logistics service quality between customers who have been installed CRM and others who haven’t. Customer C1 and C3 have implemented the system for 1 year. Customer C2 and C4 have used the system for half a year. The rest customers haven’t implemented CRM yet. Figure 4-3 shows the comparison of the performance satisfaction between C1, C2, C3, C4 and other customers who haven’t implemented yet. The satisfaction level of the four customers who have implemented complaint automation system is much higher than that of the rest customers who have not implemented the system. Customer C1 has the highest satisfaction level, which is 70% higher than that of the rest customers. The satisfaction level of customer C2, C3 and C4 is 46% higher than that of the rest customers.
Figure 43 Customer satisfaction level comparison
Besides overall satisfaction on logistics service performance, we want to know the satisfaction difference in each of the area of logistics service between customers who have implemented CRM and others who haven’t. The logistics service provided by YCH consists of 5 major parts, which are:
-
Warehouse and distribution management: how efficient the warehouse operation is; what is the order fulfillment rate.
-
Inventory management: how accurate the inventory forecast is; what is the average pipeline inventory; how about the stock out rate
-
Freight Forwarding: the average processing time of custom brokerage; the total cycle time
-
Reverse Logistics: the accuracy of damage part identification; operation cycle time
-
IT consultancy: the efficiency and convenience of the information service, including order track, online procurement and new sales enquiry etc.
Figure 4-4 shows the comparison of satisfaction on 5 type logistics services between customers with and without CRM implementation. Customers with CRM implementation showed an average 52.3% higher satisfaction level in all types of services than those customers without CRM. Complaints analysis. Largest satisfaction difference occurs in reverse logistics. Customers with CRM implementation showed 81.8% higher in satisfaction level than those customers without CRM implementation. Smallest satisfaction difference occurs in freight forwarding. Customers
Figure 44 Satisfaction level comparison
with CRM implementation showed only 28.6% higher in satisfaction level than those customers without CRM implementation. Based on the data analysis, we can conclude that CRM implementation may increase satisfaction level.
Complaints analysis
In section 4.3, we have proven that new complaint handling automation system can shorten response time significantly. In section 4.4, we have concluded from the survey data that customers with new complaint handling system are more satisfied with logistics service as well. As we mentioned in section 3.4, complaints reflect customer measurements of service quality. By analyzing complaints, companies can better target on the service problems and make an improvement. That may be the reason why customers with new complaint handling system are more satisfied with service performance as well. In this section, we try to do some analysis on the complaints collected from new complaint handling system in YCH to see how complaints can help YCH target on the problems and make according improvements.
By counting the number of complaints received in each sector in operation, the company can then figure out the performance of each sector. Figure 4-5 shows the histogram of received complaints
Figure 45 Complaints analysis
so far in each support sector. There are three statuses of the complaints. When a customer keys in the complaints and the system confirms to receive the complaints, the status of the complaint is “outstanding”. When the staffs investigate the problem and give solutions, the status of complaints is “acknowledge”. When the customer is satisfied with the solution provided, he can then make the complaint status to “closed”. Among all the support sectors, warehouse and freight have received the most complaints. From 2001, 10 to so far, totally 183 complaints are received. Warehouse sector has received 100 out of them, which is 54.6% of the total complaints. Freight sector has received 64, which is 35% of the total complaints. Together they stand for around 90% of the total customer complaints. It is necessary to deeply investigate on why there have been so many complaints in warehouse and freight sector. All the complaints of warehouse sector can be concluded into 5 categories. The complaints from each category are caused by one similar problem. The 5 major causes are: wrong label, later or wrong delivery, damaged cargo, input error and system error respectively. Figure 4-6 shows the percentage of the complaints that are attributed to each cause. “Late or wrong delivery” is the most frequent cause, which is responsible for 45% of the complaints. Both “wrong label” and “Damaged cargo” are the second frequent causes that each is responsible for 18% of the complaints.
Figure 46 Cause of the complaints in warehouse sector
“Input error” and “system error” are two less frequent causes, responsible for 12% and 7% of the complaints respectively. Similarly, 5 major causes, wrong calculation, wrong or missed process, input error, delayed shipping and document error, are responsible for the complaints in freight sector. Figure 4-7 shows the percentage of the complaints that are attributed to each of the cause. “ Document error” appears as the most frequent cause, which is responsible for 56% of the
Figure 47 Cause of the complaints in freight sector
complaints in freight sector. “Delayed shipping” which is responsible for 20% of the complaints, is the second most frequent appearance in the complaint cause. This is followed by “wrong calculation”, which is responsible for 10% of the complaints. “Input error” and “wrong or missed process”, each of which is responsible for 7% of the complaint in freight, are the two least causes for the complaints in freight. If we consider all the causes in both warehouse and freight sector and sort them according the percentage of complaints received, we may get a clear picture on the area where the company should make improvement in the first priority. The formula to figure out the percentage is as follows: Global percentage=55%(if it is the cause in warehouse sector) or 35%(if it is the cause in freight sector)* the percentage of the complaints that attributes to this cause. Table 4-1 lists the global sequence of the causes according to this formula.
* We combine two input error in both warehouse sector and freight sector into one cause.
We can conclude that the company should pay most attention to on-time delivery and verify the international freight document.
Benefits of CRM—enlightened employees
Overview
Besides the benefit of increasing customer satisfaction, CRM implementation has achieved another benefit in YCH, which is to enlighten employees to better understand customer requirements. No matter how sophisticated the automation system is, the essence of relationship building is between people. It is a big success if CRM implementation can “teach” employees the right way to deal with customers. To investigate whether the implementation has enlightened employees towards more customer-oriented, we conducted an internal survey whose target respondents are key employees in each department of YCH. By comparing their response towards the questions raised in the survey before and after CRM implementation, we can conclude that whether CRM implementation has succeeded in changing employee’s concepts and behaviors.
Internal survey
The survey is by means of questionnaire. 12 questions are listed in the questionnaire to find out to what extent the respondents understand their customers. A four-point-scale, “ Yes—4 points, Partial—3 points, Not sure—2 points, Totally lost—1 point” is employed to measure the understanding of customers by YCH employees. The questionnaires are distributed among YCH employees who are involved in the CRM program. The survey is conducted twice, before implementing CRM program and after implementing CRM program. To keep it comparable, all respondents should be the same people during two surveys. We chose 10 target respondents who are the supervisor of the involved sector in YCH. The first batch of 10 questionnaires was distributed on early July, which was before the date of CRM launching and 10 questionnaires were returned on Mid August. The return rate is 100%. The second batch of questionnaires was distributed on Late August, until which CRM had been launched for 1 month. 9 out of the 10 questionnaires were returned. Because one employee was not in the company any more, 9 out of the 10 questionnaires were matched in two rounds surveys. The return rate for the questionnaires is 90%. YCH has claimed that no similar CRM program was launching during these time, which prevents the possibility of affecting respondents’ choice by other program.
Data analysis and discussion
Except for the last question, which is “Are you ready to implement CRM with your department”, all the rest questions can be divided into two categories. The first category is about “know what”, which includes “ know top 5 customers”, “know customers’ needs”, “know the gap between customer expectations and what they are getting”, “ know the process that contribute to the gap” and “review and identify the pitfall”. The other category is about “do what”, which includes “provide customer support to customers”, “measure service quality”, “receive customer feedback”, “develop improvement according to feedback”, “share customer feedback across departments” and “receive preventive initiation from the department”. The 4-point score stands for a most positive response while the 1-point score stands for a most negative response. The 2-point score and the 3-point score are in between. The score gained from the 12 questions represents the status of the respondent’s attitude towards his customers. The higher the score a respondent get, the more positive his attitude towards his customers. Figure 5-1 shows a comparison between the average score of the respondent samples before CRM implementation and the one after CRM implementation. As we can see in the figure, the average score of the respondents before CRM implementation is 37.22 (the full mark is 48)
Figure 51 Internal survey scoreboard I
while the average score after CRM implementation is 43. The average score has increased by 15.53%. From the statistics result, we can conclude that CRM implementation do have an effect on the employees’ attitudes towards customers. Besides the impression of the general picture, we want to investigate whether CRM implementation has a greater effect on understandings or on actions. Figure 5-2 shows the comparison. Employees’ response on “ know what” type questions can represent the understanding of CRM while the response on “do what” type questions can reveal their real action towards CRM.
Figure 52 Internal survey scoreboard II
Before implementing CRM, the average score on “know what” type of questions is 3.13 and the average score on “ do what” type of questions is 3.2, with only 2.25% gap. After implementing CRM, the average score on “know what” type of questions is 3.49 and the average score of “do what” type of questions is 3.63, with 4.03% gap this time. It implies that CRM implementation may affect the actions a little more than the understandings. The explanation for this may be that some employees actually are doing something positive to their customers but they do not aware why they should do so and the potential benefits for doing so. Now we narrow down the scope to each of the two question categories to make a further investigation on the collected data. Figure 5-3 shows a histogram of each question’s score before CRM implementation. We can find from the figure that question No. 4 received the lowest scores, which is 2.67. No.4 is the question “Do you know the gap between customers’ expectations and what they are getting?” It indicates that most employees either do not understand customers’ expectations or are not clear about what they are actually delivering.
Figure 53 Comparison of employee response before and after CRM implementation
On the other hand, we find that question No.1 got the highest score, which is 3.67. The question is “ Do you know who are your top 5 customers”. Such a response reflects that most employees already have a concept of customer value and priority. After beginning CRM implementation, Question No.5, which is “Do you know what are the processes that contribute to the gap”, received the lowest score (3.11). It seems that after CRM implementation, most employees have realized the gap existing between customer expectations and the actual service quality but still they have no idea about how to fill in the gap. This is the main task of further CRM implementation. Question No.1 is still the one that received the highest score after CRM implementation, which is 3.89. The result almost reaches the full mark, which are 4. It shows that almost all employees can identify their top 5 customers after several months of CRM implementation. We also notice that the score received by question No 11, which is “Do you receive preventive in initiation from the department” has increased by 24% after CRM implementation. The increase rate is the highest among all the questions. Most respondents revealed that the new implemented complaint handling system can provide them most preventive suggestions. On the other hand, only 3.11% has increased in the scores received by question No. 6, which is “Are your operation or service being measured”. This is also the lowest increase among all the questions. But since the score itself for the question is 3.67, which is already high, the space for the improvement has been limited. Therefore we cannot regard CRM implementation has least effect on the quality measurement.
Based on the data analysis, we can conclude that CRM implementation can enlighten employees to better understand customer requirements. The impact is more obvious on employees’ behavior than on their concept. Further implementation is necessary for changing their CRM concept.
Customer segmentation
Overview
CRM is expensive therefore not all customers are worth implementing CRM. Before implementing any system, companies should determine customer values. The investment in CRM implementation is then justified by the determined value. There are a lot of criteria to determine customer value, such as profits, revenues, volume, etc. Different companies may find out their own suitable criteria to determine customer value. This chapter introduced a profits-based rule to determine customer value. But unfortunately, the model cannot be applied in YCH case because of lack of some data. Alternatively, we propose a revenue-based criterion to determine customer value in YCH. Besides value, customers are differed in relationship status as well. We use leaving barrier to measure the relationship status. A higher leaving barrier usually means a better relationship status. The leaving barrier is determined by five indicators, which are life cycle, relationship depth, satisfaction, price sensitivity and competitions. By conducting an external survey among 15 key customers of YCH, we collected their response in those 5 indicators and quantified the results. Then, we segment all customers in YCH in terms of two dimensions. One is the value dimension and the other one is the leaving barrier dimension. With different combinations of two dimensions, we create a nine-cell strategy model in order to segment customers and decide their priority to allocate company resource.
Heuristic customer profitability model
This model was first brought forward by Charles Wilson in his book “Profitable customer” 1996. The criterion used in the model to determine customer value was profitability. Unlike other models, it introduced an idea of lifetime profitability instead of annual profitability. It argued that companies should compare customer values in terms of the profits created by customers during their whole life cycle. Therefore, if customer A generates 30% higher annual profits than customer B does, but the life time of customer A is half of that of customer B, then the model considers that the value of customer B is higher than that of customer A. The model is described as follows:
Variable parameters:
S—recent annual sales
r—anticipated sales increase/decrease rate of the industry
e—expected relationship length from now
OC—operation cost
IC—interface cost (including sales & marketing, customer service and administrating cost)
CP—customer profitability in its lifetime
This model can be used in 3PL industry to figure out the profitability of customers. Instead of some stationary model, this model employs a dynamic concept, which considers the profit of a life long concept. In addition, the exponential index e rather than simple multiple e takes the industry trend into account as well.
Customer value segmentation in YCH
Besides profitability, other parameters can also measure customer value, such as revenue, cost and volume etc. The reason for choosing profitability as the primary measurement is because it can reflect both revenue and cost thus give a comprehensive picture of customer value. Unfortunately, for some confidential issues, the profit data from the YCH is not accessible. Therefore, the Customer Profitability model does not work due to lack of some cost parameters. But still we can estimate the customer value approximately by comparing the revenues instead. By comparing both revenue and volume, we can thus rank all the customers and regard it as the value rank also. Basically, the sample 3PL YCH has three business categories, which are electronics, chemicals and fast-moving consuming goods (FMCG). The annual revenue for each business category is shown in figure 6-1. As we can see in the figure, electronic contributed highest revenue, tightly followed by chemical. FMCG was the least revenue generators. Such a revenue structure is reasonable because the value of both electronic and chemical products per square feet is much higher than that of FMCG products. Therefore electronics and chemical customers generated more revenues than FMCG customers did. Although electronic currently generated a little more revenue than chemical did, chemical customers seem to be more important to the company. The reasons are as follows:
- The chemical industry is more stable than electronic industry. Electronics industry is usually
Figure 61 Total revenues for three business categories
affected by its life cycle, which causes large variable in revenues between peak period and recession period. Such a large variance affects not only YCH’s revenue directly but also volumes as well. Sometimes YCH has to make a sudden adjustment according to the variance. During the recession period, some electronics manufacturers are forced to cut cost in order to survive. Then they ask a lower rate for logistics or terminate the contact even. No matter how satisfied they are to the 3PL partner, they still have to terminate the relationship because of the business recession. But chemical industry develops in a stable pace. It is rare that a satisfying chemical customer will terminate the 3PL contract because of the economics factor. Therefore, the relationship with chemical customers is much easier to maintained.
- Another recession in electronic industry is expected while chemical industry is expected to develop continuously. Currently, chemical contributes only a little less than electronic does but it seems that the revenue from chemical can exceed that of electronic in the near future.
Among all chemical customers, four of them together contributed 80% of the whole group’s revenue. These four customers, who are C1, C2, C3 and C4, are identified as the most valuable customers. One electronic customer, named E1, contributes 60% of the total revenue of the electronics group. So E1 is also regarded as one of the most valuable customers. All other electronic customers, E2, E3, E4 and E5 and the rest chemical customer C5 are divided into second valuable customer group and five FMCG customers, named F1, F2, F3, F4 and F5 are set as the least valuable customer group according to their revenue contribution. Table 6-1 summarized the customer segmentations
Customer leaving barrier
Besides customer value, relationship depth is another factor that should be considered in customer segmentation. We want to know the possibility for a customer to be retained. Therefore we introduce the concept--customer-leaving barrier, which is used to measure the possibility for a customer to leave. The higher the barrier is, the lower possibility the customer is going to leave. To measure the leaving barrier quantatively, we employed five indicators: customer life cycle, business coverage, performance satisfaction, price sensitivity and competitors. We conducted a questionnaire survey among the 15 customers and determined the leaving barrier according to their response to the survey. Each customer can have a total score by summarizing five indicators’ scores. And the leaving barrier for each customer can be measured by the total score. The higher the score is, the higher the barrier is. Figure 6-2 shows the average barrier status of all sample customers in different value hierarchies. The figure reveals that the leaving barrier for the first class customers is much higher than that of second class and third class customers. Recall the internal survey result that most Y’s employees can identify their top 5 customers. Therefore it is reasonable that the employees may take more care of those top 5 customers’ business. Usually the top 5 customers always belong to the first class valuable customers. The additional care from the company may make the barrier for the first class customers higher than that of second and third class customers.
Figure 62 Leaving barrier for three class customers
Nine-cell strategy model
Since we already have customer value and leaving barrier, we can combine two variables together to form a matrix, which is used to identify customer priority. The matrix consists of two dimensions. One is value status and the other one is leaving barrier status. Each dimension of status can be divided into three levels, high, middle and low. Thus the area is divided into a 9-cell grid, as shown in figure 6-3. Each customer can be
Figure 63 Nine-cell strategy model
Located at one of the nine cells according the following rules:
- First class customers are regarded as high value, second class customers are regarded as middle value and third class customers are regarded as low value
- We purposefully set average points for all five indicators as middle level of the barrier. If a customer’s barrier is higher than the average points by 10%, then we regard the customer has a high leaving barrier. If lower than the average points by 10%, then we regard the customer has a low leaving barrier. Otherwise, the customer has a middle level leaving barrier. Figure 6-4 shows the new 9-cell grid with all customers located.
Figure 64 Updated nine-cell with customer allocated
Figure 6-4 shows a picture of customer segmentation based on customer value and leaving barrier. The segmentation itself is meaningless until we set different strategy to different segmentation. Figure 6-5 is the strategy option for the nine-cell grid model. The number in each cell represents the priority of resource allocation for each status of customers. CRM is very expensive since it needs a lot of investment in manpower, capital, time and effort. Such a priority illustration gives a general rule of how to allocate the limited company resource to all customers. For example, customers with high value and high leaving barrier are given the first priority of resource allocation. Customers with high value but middle leaving barrier are given the second priority of resource allocation. And so on. The rule behind the priority allocation is like this:
Figure 65 Nine-cell strategy
The position of each customer is decided by two dimensions. We give different scores for different positions in two dimensions. For value dimension, the “high” position is given 3 points; the “middle” dimension is given 2 points and the “low” dimension is given 1 point. For leaving barrier dimension, the “high” position is given 2.5 points; the “middle” position is given 2 points and the “low” position is given 1.5 points. To most 3PL companies, it is much more easier to increase leaving barrier level by satisfying customers than to increase customer value. Therefore the customer position in value dimension should be considered in a little bit more weight than that in leaving barrier dimension. The comprehensive customer status can be reflected by the summary of two dimensions’ scores. The higher the score is, the higher the priority is. For example, the position of customer A is with high value and middle level leaving barrier. The position of customer B is with middle level value and high leaving barrier. The score of customer A therefore is 3+2=5. The score of customer B is 2+2.5=4.5. Customer A has higher priority than customer B. According to the rule, we decide all priorities for all nine-cells, as shown in figure6-5.
Besides the number that represents the priority of resource allocation, the nine-cell grid model also includes nine strategy options for each status. (The original nine-cell grid model is cited from chapter 3, Ken Burnett, “The handbook of key customer relationship management”, Prentice Hall, 2002) The exact meanings for each strategy option is as follows:
- Defend and maintain—defend the customer’s contribution, prevent the share wallet from the competitors. Maintain the leaving barriers by increasing customer’s satisfaction.
- Develop—strengthen the barrier by increasing customer satisfaction and solving their problems.
- Develop selectively—strengthen the barrier that maximizes the input-output-ratio and give up some low input-output ratio options.
- Attract—snatch the customer’s wallet share from the competitors thus increasing the customer value.
- Attract selectively—selectively invest on the customers that have the potential to be higher value customers.
- Maintain—Maintain the current customer value and leaving barrier level but will not invest more.
- Maintain selectively—Maintain either the current value or leaving barrier level according to maxim input-output rule, sometimes reduce the investment.
- Withdraw—Stop investing on the customers until the status change.
Combine the results of figure 6-4 and figure 6-5, each customer has been set a priority of resource allocation and according strategy. We summary the results as follows:
Customer C1, C2, C3, C4
Priority: 1st
Strategy: defend and maintain
Customer E1
Priority: 2nd
Strategy: develop
Customer E3, E4, C5
Priority: 3rd
Strategy: maintain
Customer F3
Priority: 4th
Strategy: attract selectively
Customer E2, E5
Priority: 5th
Strategy: maintain selectively
Customer F2, F5
Priority: 6th
Strategy: maintain selectively
Customer F1, F4
Priority: 7th
Strategy: withdraw
Recommendation of further implementation
Overview
Customer complaint handling system is just one part of CRM implementation. It can affect the relationships with customers in some extent but not that much. Some other components must be added in so that they can help to strengthen the relationship in the whole business cycle. This chapter is going to introduce other components of CRM application, which includes sales and marketing automation and performance measurement automation. In addition, separate components cannot be regarded as a CRM system unless they are integrated into a system. This chapter gives a comprehensive picture on how to combine components together and make them work as a system.
Sales and marketing automation
Sales department is an important sector in all industries, not exclusively in 3PL industry. The factor is that when sales suffer, the whole company will suffer. All business relationships start from sales. The performance of sales in any company is a key factor to affect customer satisfaction. Besides, the performance of sales is also a major measurement of CRM implementation. Why companies invest so much in building relationship with customers? It is because they want to retain these profitable customers and keep them generating more profit for the companies. Given a good pass, an excellent striker could make a perfect finish and help his team win. Same situation happens in CRM implementation. Having invested so much in customers, the company expects that the sales agents could make more business with the satisfied customers.
How CRM can change the traditional sales methods
CRM employs some software tools to automate sales procedures, reducing average sales cycle and increasing sales efficiency. The software consists of a back database and some front application tools, such as forecasting, data matching and data-mining. In 3PL industry, quotas and forecasting are two key issues in sales. The more exact the quota is, the more likely the company can win the deal. But it is complex to determine the quota for all companies. If the quota is too high, then customers will definitely accept the competitor’s deal. If the quota is too low, the company may make less profit even make a loss from the deal. Before providing a quota, company’s sales agents need to collect a lot of information, both customers’ preference and competition status. So much information makes sales agents tired and could do nothing else. The software tools act as a decision-make supporter, helping sales agents to make accurate responses quickly. The database contains all customer information and can sort out useful information according to agents’ requirements. For example, the agent can easily browse the latest deal of a customer and plot the trend, whether is up or down. Better understanding customers’ requirements, an agent can hit on target more accurately. Besides quotas providing, forecasting is another tough issues for traditional sales. Because constrained by the resource capacity in warehouse or trucking load, the demand is highly associated with the quotas. In the traditional sales method, each agent only followed up his own sales progress and didn’t know others’. It is not convenient for the sales manager to coordinate and form a comprehensive forecasting. With sales automation system, each agent can clearly get all of the prospecting information, making a good forecasting on total demand. In addition, CRM can bring another benefits to sales force. Traditionally, the relationship between customers and the company are controlled by sales agents. The agent may understand his customer’s preference and have won the customer’s trust. But no documentaries are left in the company. Someday, when the agent leaves the company, he also takes away the existing relationship with his customer since no one except him really understands the specific customer. Therefore, it is highly risky for the company to let sales agent go because he has customer profile data. Someday the relationship with customers will be won by the competitors together with the sales agent. CRM can prevent such a risk. It can help companies to build a sophisticated customer information database. In that case, if the former agent leaves, the successor can take over easily by reading all the existing data from the database. The relationship is more likely to be retained in the company.
The concept of cross-selling/up-selling in 3PL industry
Cross-sell refers to selling one product to some sub customer account that belongs to one customer. In 3PL industry, sub customer accounts can be regarded as worldwide branches of a multi-national company and the selling product is of course the logistics service. Many 3PL companies themselves are also multi-national companies, such as Bax Global, Exel, TNT etc. Many MNC companies prefer to outsource their logistics work to one 3PL companies worldwide unless local 3PL companies can provide a much better job. In addition, the venture movement of those big companies often implies a good business potential in some places. If the 3PL companies can catch that information from customers and follow up, they can get more sales opportunities.
Up-sell refers to selling one product to one customer but with higher version. In 3PL industry, it means providing a more integrating logistics service. YCH, for example, classifies all its logistics services into three categories: intribution, intrabution and retrogistics. Intribution is an integrating logistics service to manage the flow of raw materials, information and financial transactions between a manufacturer and its suppliers. Intrabution seeks to bridge the complexity in goods distribution up to retailers and end customers. Retrogistics is a reverse logistics operation, managing the return of salvaging parts from customers to manufacturers. Customers of YCH can choose any or all of the three integrating services. For those customers who choose one of the three services, YCH may up-sell the other two to the customers. If a customer uses both intribution and intrabution services, then he is regarded as a node customer. Otherwise he is a branch customer.
Figure 71
Figure 7-1 shows a simplest model of the relationship in a supply chain. Company A has 3 suppliers, named S1, S2 and S3. It also has three customers, named C1, C2 and C3. Now A is using both intribution and intrabution service. It is the node customer of YCH. Because of the features of intribution and intrabution, both suppliers and customers of customer A are all YCH’s customers. But since they only use either intribution or intrabution service, they are only branch customers. All these branch customers have the potential to be node customers. Since each supplier may have at least three own suppliers, totally 9 potential new customers will be introduced into the system. Due to the capacity restriction, YCH cannot prospect all the new customers at one time. Just as the idea that all customers have different value, all suppliers have different value too. Therefore we should segment all suppliers in terms of profitability and the relationship status with customer A. Figure 7-2 shows an expanded supply chain relationship. Suppose that S3 has been developed to a new node customer and it has three another suppliers, namely S5, S6, S7. Besides company A, S3 also has another 2 customers, namely B and C. By developing S3 to a node customer, YCH has prospected another 5 new branch customers; S5, S6, S7, B and C. Originally, most of customers in YCH are separate individuals without relationships. Now customers are linked by the supply chain.
Figure 72
Such an up-sell solution can create a win-win situation for both YCH and its customers. The benefits for YCH to do so is as follows:
- It can bring YCH more node customers. Since node customers are the major revenue contributor. So more node customers can bring more revenues.
- It can bring YCH more new branch customers. They are potential node customers in the future and can generate some revenues.
- It can increase the involvement of YCH in supply chains. By repeating the up-sell process in a supply chain, more and more key players of the supply chain will be YCH’s customers. More involvement for YCH in a supply chain may increase the customers’ shift cost therefore can retain customers in that supply chain because it is not easy for them to switch all relationship along the supply chain to another 3PL company. The more important relationship between a supplier and its customer, the more likely both the supplier and the customer keep loyal to YCH. Because as a logistics provider, YCH is the key tier of such an important relationship between the supplier and the customer.
Besides the benefits to YCH, it can also bring benefits to YCH’s customers as well, which is as follows:
- It can increase the visibility and reliability of the order fulfillment among the supply chain. Suppose there is a simplest supply chain, including one supplier, one manufacturer and one customer. If the supplier and the manufacturer have different 3PL providers, then the logistics job will be more complex because of the coordination between 3PL companies. Different systems between 2 3PLs companies may decrease the visibility of the order fulfillment. When the customers want to know the status of the order, neither of the 2 3PL companies could exactly answer. In addition, the more parties involved in a supply chain, the more variable it is. Most variance in a supply chain is due to the error occurred between two individual parties, such as between different 3PLs or between suppliers and manufacturer, etc. This is key factor that lengthens the cycle time. So less 3PL companies in a supply chain can increase the efficiency and reliability of the supply chain.
2. Customers can have discounts from the result of cost reduction from YCH. We still use the above supply chain as the example to explain the reason. Compare the two cases. Case 1, both the supplier and the manufacturer have their own 3PLs. The supplier’s 3PL ships all raw materials from the supplier’s plant to its warehouse. When the manufacturer places an order, first the supplier’s 3PL ships the order to the warehouse of the 3PL of the manufacturer. Then the manufacturer’s 3PL ships the materials to the manufacturer. Case 2, the supplier and manufacturer have the common 3PL. The 3PL ships raw materials from the supplier’s plant to its warehouse. When the manufacturer places an order, the 3PL do not need to physically move the materials. Instead, it can just change the ownership of the materials. It can save a lot of transportation and material handling cost.
Components of sales automation
Basically, A data warehouse is a huge database, which develops an institutional memory. Companies have built data warehouses to unleash the business value locked away in their operational systems. Like a conventional reporting system, a data warehouse contains information, which ranges from the general background information of a customer to the transaction record information of a customer. The difference is that a data warehouse extracts information from existing internal and external sources, then standardizes and consolidated that information, and finally stores it for easy access and retrieval. In summary, a data warehouse combines the following:
- One or more tools to extract fields from any kind of data structure (flat, hierarchical, relational, or object; open or proprietary), including external data
- The synthesis of the data into a nonvolatile, integrated, subject-oriented database with a metadata "catalog"
Account Management Module
This module is used to record each customer account’s profile information. It can help sales agents to quickly be familiar with customers’ backgrounds and requirements. Customers may feel they are dealing with their old friends who know each other well rather than a stranger who is hard to communicate. Generally, the module records such kind of information, including:
- Customer background information
- Contact person preference
- Credit status
- Contract status
- Payment history
- Total revenue contribution
- Current business development trend
- Customer complaints history
- Solution
Once a new customer approaches to a sales agent, the customer’s information will be input into the database. When the customer comes again, the system will know who is the customer and can reflect all related information to sales agents. Also, the system can sort out information according to agent’s specific requirements. For example, it can list the top 5 deals history and plot a trend diagram. Also, it can reveal the total revenue contribution among all customers to see whether the customer is a key customer.
Opportunity Management Module
It is important to make use of any sales opportunity. By tracking all customers’ information, CRM seeks to help companies identify each opportunity and make accurate actions as soon as possible. This is the main function of opportunity management module. The sales opportunities can be classified into two categories.
- Prospecting new contracts
In 3PL industry, sales cycle is usually divided into three steps, which are:
It is particularly important to realize contract expiration dates because it is a good opportunity to prospect new contracts. It is common that customers may take highly account into the proposal that comes in the first place. Therefore it maybe too late for a 3PL company to submit a proposal when the customer is asking for. The real situation is that the customer already has some good proposals on desk and just want to compare the price. But it is quite hard to just compete on price with all competitors. So in most case, the latter one will lose the game. Sales automation may trigger the new sales campaign when contract expiring dates are coming, giving enough time to sales agents to prepare for the incoming campaign.
- Up-selling an existing contract
People are motivated to act when there is discrepancy between that person’s perception of reality and the desired results. That discrepancy may be perceived as a problem or an opportunity:
- Problem perception—a situation where actual performance is below expectations—provides the highest probability of sales success. It has been said that fear of loss is a greater motivation than desire for gain and, provided that the person is aware that there is a problem, the bigger the problem, the more urgently the solution options will be explored. Some customers may have outsourced part of their logistics to 3PL companies and keep the rest inside. Then some problems occur in logistics and damage the total business. If the 3PL companies can identify the problems which are caused by the internal logistics part and convinced the customers how big are the problems, then they can provide a solution that outsource the rest part of logistics also.
- Opportunity perception is a situation where actual performance is meeting or, perhaps, exceeding expectations but the person can see opportunities for improved performance.
Both problems and opportunities can be a trigger for customers to buy a new service. Opportunity management module can help to find out the problems and opportunities according to customer feedbacks.
Marketing Management Module
Marketing is another stage that communicates with customers frequently. It both sends out the prospecting information and collects customer feedbacks. One of the measurements is marketing efficiency, which is the ratio of sales revenues divided by marketing costs. Though the revenues cannot all attribute to marketing effect but to some extent, the effect of marketing may change the revenues gradually in long-terms. The evaluation of the marketing effect is to check the on-target hit rates, which is distributing a right advertisement to the right person at right time. Marketing management module is the one that aims at exploring the requirements of each customer. Using data-mining tools, this module can recall the history of the customer purchase behavior and anticipate the customer’s current needs, making a good advertisement on the right people. For example, a 3PL company has installed a ASRS system in its warehouse recently. Now it is a good opportunity to let customers know the updated facility and build a good image for further prospecting. Since the company has many customers and mass marketing is costly and low efficient. Marketing management module is the exact tool to handle with the situation. By reviewing the customer database, the system can then sort out some customers who had asked about the ASRS system. Of course, some fast-goods moving products manufacturers may be the best candidates. Some high tech companies with highly innovation may also a good target on marketing. The system may intelligently search the customers’ contact preference and suggest a most efficient contact way. For example, if some customers like telemarketing while some prefer to receive e-mail.
Performance measurement automation
It is hard to win a game without a scoreboard. In 3PL industry, performance measurement from customers is the scoreboard. The performance measurement is a “free” hint to tell the company what should be improved and whether the investment on some facility is justified. A typical way to do performance measurement is to send out a survey form. Table 7-1 shows a typical performance measurement form in 3PL companies. Traditionally, all customers may receive the
Table 71 Sample performance measurement form
same survey form. This may lead to a disadvantage. The survey form cannot be designed in too detail because different customers may have different services. Only common questions are listed. But a detail answer may better help a 3PL company understand the real problems. Therefore scoreboard should be customized. But it is tough for any person to design different scoreboards for each customer manually since so much information is involved. CRM expects a computer-based tool to make it complete automatically. The steps are as follows:
Step 1. Design a complete scoreboard with all services and parameters included manually.
Step 2. Key the scoreboard into the system.
Step 3. Let system match the customers with the service they are currently having.
Step 4. Let system match the services with related service parameters
Step 5. Let system match the customers with the according scoreboards.
Step 6. System generates a customized scoreboard for each customer.
Additionally, some improvements may be added into the traditional scoreboard. We want to make it further customized. A score weight is employed to make the scoreboard more flexible. Even for the customers who have the same service from a 3PL company, the emphasis on the perceived quality may be different. Some customers may take highly account into inventory accuracy since inventory is very expensive to them but some customers concern more about on-time delivery because the products are highly perishable. So after the above 6 steps to generate a customized scoreboard, one more step is to be added, which is to decide a weight according to customers’ business features and requirements. Table7-2 shows the updated performance measurement form with weight attached. A five-scale measurement is used, ranged from 1 to 5. 1 means the parameter is least important which only stands for 10% of the total score while 5 is the most important parameter which may stand for 50% of the total score.
Table 72 Advanced sample measurement form
How to put things together
In above section, all the components of CRM have been introduced one by one. In this section, it is going to combine all the components together and illustrate a flow chart of these components working together as a system. As shown in figure 7-3, the system is divided into three function
Figure 73 Proposed integrated CRM system flow chart
areas, which are sales & marketing automation, customer complaint automation and performance measurement automation respectively. All arrows are divided into two types, blue one and yellow one. The blue arrow represents the information flow, including decision, complaint, solution and marketing information. The yellow arrow represents the capital flow, including all the investmentsand revenues. When customers find some problems during the service, he can log on the system and the Complaint Automation module will be triggered. Customer can key in the complaint according to the instructions. Then the system will “recognize” the complaint and distribute the complaint to the support section in operations. The operation staffs may investigate the problems and take appropriate actions towards the problems. Then system may send back the solution to the customer. If the customer is satisfied with the solution, then the system will close the complaint and record both the complaint and solution to the database otherwise the system will escalate the complaint to the higher level manager of operations to seek for the further solution and so on until the customer is satisfied with the solution given. The system will generate a monthly report to reflect the number of complaints received for each section and service. In return, the highest number of complaints related to a service offered by the section shall be awarded a higher weight and link to the Performance Measurement Automation. The Performance Measurement Automation may update the parameter after receiving the parameters from customer complaint automation and generate a customized measurement form for each customer. Every month the system will automatically send out the forms and collect customers’ feedback. From the feedback, the system can investigate customer satisfaction level according to YCH’s criteria. When the system identified whichever service is below satisfaction level, it will then track from the Customer Complaint Handling Automation. This linkage allows the staff to take reference from the complaints and evaluate whether there is a necessity to take further actions to improve the situation. On the other hand, the Performance Measurement is also linked to the Sales ans Marketing Automation. It equips the sales personnel an understanding of the satisfactory level of the customers on various services. This is highly important as it gives an indication what services should be emphasized and what services should not. By such, the CRM implementation can be effective and efficient only when these 3 automation components are able to integrate as one.
Conclusion
Research overviews
Customer Relationship Management is a effective weapon for 3PL companies to build and develop a good relationship with customers. Under current circumstance, new customers are hard to acquire to those 3PL companies because of the keen competition. An alternative way to prospect new customers is to attract the customers from the competitors. As a result, those 3PL companies have to prevent their customers from being attracted by their competitors. Though CRM has come into existence for ten more years, the application of CRM in 3PL industry is still a new topic to study. In this thesis, we first review several literatures on some issues of CRM implementation, including the definition of CRM, the evolution of CRM, the benefits and perils of CRM implementation, the way to determine customer value and the relationship between customer satisfaction, customer retention and profitability. By reviewing these literatures, we understand the general process of CRM implementation and the important issues in CRM implementation. Unfortunately, few literatures have been conducted on CRM implementation in 3PL industry. We therefore conduct a comparison between neo-manufacturing industry, represented by Dell and 3PL industry in order to find out the similarity and difference between them in terms of CRM implementation. Our idea is that if some similarities do exist in both industries, then some of the successful implementing experience in manufacturing industry can be applied in 3PL industry. Two major differences are found during the comparison. First, Dell is a manufacturer while 3PL companies are one type of service provider. Customers of Dell pay more attention to actual quality of the products but customers of 3PL companies are more emphasized on perceived quality. Second, 3PL companies concern more about capacity limitation, which is a most important criterion in decision-making. But it is not a big problem for manufacturers. Due to the business character difference, manufacturers prefer sales automation while 3PL companies take customer complaints handling automation into high account. We conducted two surveys. One is for YCH employees and the other one is for key customers of YCH. By analyzing the data from the survey, we find out two major benefits of CRM implementation achieved in YCH. 1. Increase customer satisfaction 2. Enlighten YCH employees. After that, we mention customer segmentation, which is to target on right customers. By reviewing a heuristic customer profitability model, we propose a feasible methodology of determine customer value in YCH. And then we introduce the concept of leaving barrier, which is to measure the possibility of a customer to leave. Combined both value and leaving barrier dimension, we propose a nine-cell strategy model, which is to identify the priority among all customers and set an according strategy to each type of customers. Finally, we give a proposal on adding sales automation and performance automation modules to current CRM system in YCH and the integration of these three components.
Major findings and industrial implications
Major findings
- By increasing customer retention rate, company profitability can also be increased. This is a unique feature in service industry, especially in 3PL industry. In YCH case, with the customer retention rate increase from 90% to 100%, the NAV of profit can increase 5%. (See Chapter 3)
- New customer complaint handling automation system can shorten the response cycle time in 91% and increase customer satisfaction in 52% (See Chapter 4)
- Warehouse sector received most complaints (54.6%) from customers, followed by freight sector (35%). The most frequent cause in warehouse problems is wrong or delayed delivery (45%). The most frequent cause in freight problem is document error (56%). (See chapter 4)
- Employees in YCH are enlightened to better understand customer needs. With 11.5% increase in understanding customer expectations and 13.4% increase in customer requirement fulfillment, the overall increase in employees’ attitudes towards customers is 15%.
Industry implications
Currently, 3PL companies prospect new customers mostly according to customer individual profile or even at random. Instead we propose to prospect new customers along a supply chain intentionally. The idea is that it is much easier to build a long term relationship with several members in a supply chain as a group than to do so with several separate customers in different supply chain as individuals. The more involvement of a 3PL company is in a supply chain, the more bargain power it has to negotiate with customers in the supply chain. Since both suppliers and customers may have certain relationship with 3PL companies, we propose that those 3PL companies should take advantage of such a relationship and expand it within a supply chain as much as possible.
Research limitations and Further study
Due to the data availability, we cannot investigate more 3PL companies in Singapore in terms of CRM implementation. Therefore the results and conclusions drawn above may have some bias and lose universality in some extent. In addition, due to some confidential issues, some data such as profits cannot be accessed therefore the Customer Profitability Model cannot be used. Alternatively revenue model is employed to determine customer value. But because of the similarity of 3PL business characters, the research results still can be used as a reference of CRM implementation in 3PL industry.
Due to the time limitation, the thesis cannot cover every issue of CRM implementations, which may be the topic of some further studies:
- In CRM theory, companies should segment their customers and take more care of those valuable customers. But this strategy may incur too much depend on small group of customers while ignore other large part of customers. This may bring a large variance to the 3PL companies. In addition, the discrimination between customers may bring some negative effects on those small customers and further damage the company image. It is a good topic to study how to keep balance between key customers and non-key customers.
- After we have studied the relationship between retention rate and profitability, we find that the retention rate should have some relationship with cost as well. It is a logic sense because companies may invest more to retain a higher retention rate. Due to the time and data limitation, we cannot figure out the relationship in detail. It is a good topic for further research.
Reference
- McNealy, Roderick M., “making customer satisfaction happen: a strategy for delighting customers”, Chapman & Hall, 1994
- Niraj, Rakesh, “Customer profitability in a supply chain”, Marketing Science Institute,1999
- Goodman, Sam R. “Techniques of profitability analysis”, Wiley-interscience 1970
- Hooley, Graham J. “Quantitative methods in marketing”, International Thomson Business Press,1999
- Wilson, Charles. “Profitable customers: how to identify, develop and retain them” kogan page, 1996
- Horovitz, Jacques, “The seven secrets of service strategy”, Financial Times/ Prentice Hall, 2000
- Cartwright, Roger, “In charge of customer satisfaction”, Blackwell Publishers, 1997
- “Customer satisfaction in the service sector”, Asian Productivity Organization, 2000
- Chakrapani, Chunk, “How to measure service quality & customer satisfaction: the informal field-guide for tools and techniques”, American Marketing Assoc, 1997
- Anderson, Krinstin, “Customer relationship management” Mcgraw-Hill, 2002
- Ryals, Lynette, “Customer relationship management (CRM): building the business cass”, Financial Times/Prentice Hall, 2000
- Wong, Pek San, “Customer service benchmarking in third party logistics industry”, NUS,1996
- Michale W. Lowenstein, “Customer retention: an integrated process for keeping your best customer”, ASQC Quality Press , c1995.
- Roger Cartwright, “In charge of customer satisfaction”, Blackwell Publishers , 1997.
- “Customer satisfaction in service sector”, Asian Productivity Organization, 2000.
- Chuck Chakrapani, “How to measure service quality & customer satisfaction”, American Marketing Assoc., 1997.
- Jacalyn Sherriton & James L. stern, “Corporate culture, team culture”, American Management Association , 1997.
- Joanne Smailes & Angela Mcgrane, “Essential business statistics”, Financial Times Prentice Hall, 2000.
- Mark Stwart, “Keep the right customers”, McGraw-Hill Companies , c1996.
- Katherine N. Lemon, Tiffany Barnett White, & Russell S.Winer, “Dynamic Customer Relationhip Management”, Journal of Marketing, Vol. 66, January, 2002
- Dr. Edward H. Frazelle, “Third Party Logistics” seminar notes, 2001
- Tor Wallin Andreassen, Bodil Lindestad, “Customer Loyalty and complex service”, internation journal of service industry management, Vol 9, #1, 1998
- Ian Corner & Matthew Hinton, “Customer relationship management system: implementation risks and relationship dynamics”, Qualitative Market Research, Vol 5, #4, 2002
- Rizal Ahmad & Francis Buttle, “Customer retention management: a reflection of theory and practice”, Marketing Intelligence & Planning, Vol. 20, #3, 2002
- P.B. Beaumont, L.C. Hunter & D. Sinclair, “Customer-supplier relations and diffusion of employee relations changes”, Employee relations, Vol. 18, #1, 1996
- Rhian Silvestro, “Dispelling the modern myth”, International Journal of Operations and Production Management, Vol. 22, #1, 2002
- Kaj Storbacka, Tore Strandvik & Christian Grönroos, “Managing customer relationships for profit: the dynamics of relationship quality”, International Journal of Service Industry Management, Vol.05, #5, 1994
- Ko de Ruyter, Martin Wetzels & Josée Bloemer, “On the relationship between perceived quality, service loyalty and switching costs”, International Journal of Service Industry Management, Vol.9, #5, 1998
- G.S. Sureshchandar, Chandrasekharan Rajendran & R.N. Anantharaman, “The relationship between service quality and customer satisfaction: a factor specific approach”, Journal of Service Marketing, Vol. 16, #4, 2002
- Tor Wallin Andreassen, “Satisfaction, Loytalty and Reputation as indicators of customer orientation in the public sector”, International Journal of Public Sector Management, Vol. 7, #2, 1994
- Bernd Stauss & Patricia Neuhaus, “The qualitative satisfaction model”, International Journal of Service Industry Management, Vol.8, #3, 1997
- Paul H. Zinszer, “Segmenting logistical service offerings using the extended buygrid model”, International Journal of Physical Distribution and Logistics Management, Vol. 27, #9, #10, 1997
- Nicholas Alexander, “The evolution of retailer, banker and customer relationships: a conceptual framework”, International Journal of Retail & Distribution Management Vol. 26 Number 6 1998
- Dana Yagil, “The relationship of customer satisfaction and service workers' perceived control”, International Journal of Service Industry Management Volume 13 Number 4 2002
-
Roger Hallowell, “The relationships of customer satisfaction, customer loyalty, and profitability: an empirical study”, International Journal of Service Industry Management
Volume 7 Number 4 1996
Appendix A
Internal survey questionnaire
Direction:
The survey is conducted by the student of National University of Singapore for the research use. The purpose of this survey is to measure the impact of CRM implementation on employees’ attitudes change towards customer needs. The respondents for the survey are the supervisors of every major department in YCH. The data collected from this survey will be kept confidential and all the respondent name will be omitted in the report. For those multiple choice questions, please circle the letter of the answer you choose. Only one answer can be chosen in each question.
Questions
- Do you know who are your top 5 customers?
Yes Partial Not sure Totally lost
- Do you know what are their needs?
Yes Partial Not sure Totally lost
- Are they currently receiving from you in term of service quality and customer support, etc?
Yes Partial Not sure Totally lost
- Do you know the gap between their expectations and what they are getting?
Yes Partial Not sure Totally lost
- Do you know what are the processes that contribute to the gap?
Yes Partial Not sure Totally lost
- Are your operation or service being measured?
Yes Partial Not sure Totally lost
- Do you review and identify the pitfall
Yes Partial Not sure Totally lost
- Are you receiving feedback from your customer?
Yes Partial Not sure Totally lost
- Do you develop improvement plans after receiving the feedback?
Yes Partial Not sure Totally lost
- Do you share the feedback across the department?
Yes Partial Not sure Totally lost
- Do you receive preventive initiation from the department?
Yes Partial Not sure Totally lost
- Are you ready to implement CRM within your department?
Yes Partial Not sure Totally lost
******************************************************************************
You may end here.
Thanks for your cooperation!
Appendix B
A Survey on the Customer Relationship Management (CRM) implementation in YCH
Direction:
The survey is conducted by the student of National University of Singapore for the research use. The purpose of this survey is to measure the customer satisfaction of YCH’s customer and the effect of Y-service program. The respondents for the survey are the key customers of YCH. The data collected from this survey will be keep confidential and all the company’s real name will be omitted in the report. The survey is divided into two sections, Section A and Section B, respectively. Section A is about the company profile information. Section B is the question part of the survey. For those multiple choice questions, please circle the letter of the answer you choose. Only one answer can be chosen in each question.
Section A
Name_________________________ Company_________________________________________
Title__________________________ Address of the company_____________________________
Tel_____________________Fax____________________E-mail___________________________
Age of the company______________________ Business Category____________________
The approximate number employees__________________
Section B
- How long have your company outsourced the logistics work to YCH?
a. < 2 years b. 2—3 years c. 3—5 years d. >5 years
- Which logistics work of the following is needed to support your core business?
a. Intribution b. Intrabution c. Retrogistics
3. How many logistics work have your company outsourced to YCH?
a. Intribution b. Intrabution c. Retrogistics
4. Please give marks to the logistics service that YCH is providing you. If the following service is not the one you are using, then just leave it blank.
- Warehouse and distribution management
a. Excellent b. Good c. Average d. Poor e. Unbearable
a. Excellent b. Good c. Average d. Poor e. Unbearable
- International Freight Forwarding
a. Excellent b. Good c. Average d. Poor e. Unbearable
- LTL or TL trucking service
a. Excellent b. Good c. Average d. Poor e. Unbearable
- Repair products collection (Reverse logistics)
a. Excellent b. Good c. Average d. Poor e. Unbearable
a. Excellent b. Good c. Average d. Poor e. Unbearable
a. Excellent b. Good c. Average d. Poor e. Unbearable
a. Excellent b. Good c. Average d. Poor e. Unbearable
- Consultancy and supply chain design
a. Excellent b. Good c. Average d. Poor e. Unbearable
5. What do you think of the price of the logistics service provided by YCH?
a. Worthwhile for the service provided b. Acceptable
c. Too high to accept
6. How many third party logistics companies are you currently using to outsource your logistics work?
a. 1 b. 2 c. >=3
7. Before implementing Y-service program, what channel did you use most frequently for complain?
a. e-mail b. telephone c. monthly meeting
8. Before implementing Y-service program, what is the average response (means a solution or explain is given by YCH) time?
a. Within 3 days b. Within 7 days c. Within 2 weeks d. Within a month
9. How long have your company implemented Y-service program?
a. 3 months b. half a year c. a year
10. After implementing Y-service program, what is the average response (means a solution
or an explain is given by YCH) time?
a. Within 3 days b. Within 5 days c. Within 7 days d. Within a month
11. Do you think the solution given by Y-service system is efficient?
a. Most are efficient b. Only a few are efficient c. Not efficient at all
*******************************************************************************
You may end here
Thank you for your cooperations!
Appendix C
Introduction of YCH
YCH were established in 1955 as a small local passenger transportation business under the name of Yap Chwee Hock Transport and General Contractors ("YCH Transport"). In 1973, YCH Transport was converted from a sole proprietorship to a private limited enterprise and was renamed Yap Chwee Hock Transport Pte Ltd, which is today known as YCH Global Logistics Pte Ltd
In 1977, YCH undertook a strategic decision to redirect our passenger transportation business to cargo transportation and in the following year, became one of the major cargo transport contractors for the then Port of Singapore Authority. In the early 1980s, YCH diversified into the business of warehouse leasing and the provision of freight forwarding services via the acquisitions of Freight Connections Worldwide Pte Ltd and Regional Forwarding & Warehousing Management Pte Ltd ("RFWM") in 1982 and 1983 respectively. RFWM was incorporated in Singapore on 6 October 1980 as a private exempt limited company and was renamed YCH Logistics Pte Ltd on 17 March 1989. In 1999, YCH Logistics Pte Ltd was renamed YCH Group Pte Ltd and presently serves as our holding company.
In the mid-1980s,YCH grew from a warehousing and cargo transportation provider to an integrated third party logistics company providing services such as warehousing, distribution inventory management and freight management. In line with the growth of our business, YCH established a number of distribution centers to manage the warehousing and regional distribution for MNC clients in 1991. YCH developed and completed our present headquarters, known as YCH DistriPark, in 1992. The establishment of YCH Malaysia in 1991 marked YCH’s first foray overseas. In 1993, YCH set up PDC-YCH DistriPark Sdn Bhd, a 51% owned joint venture with Penang Development Corporation, to operate a distribution hub in Penang. This joint venture in Penang is fully operated and managed by YCH. In 1993, YCH also opened the Roche Distribution Center in Singapore to manage the logistics needs of Roche. In 1994, YCH expanded into China and set up operations in Shanghai to operate a distribution hub by way of a 51% owned joint venture with Shanghai Wai Gao Qiao Free Trade Zone United Development Co and China Ocean Shipping Agency Shanghai. This joint venture in Shanghai is fully operated and managed by YCH.
In 1995, YCH made an investment to build an automated storage and retrieval system warehouse in Singapore. In 1997, YCH commenced operations in Hong Kong through the establishment of YCH Hong Kong.
With the growing trend of logistics outsourcing and the increasingly complex requirements of YCH’s clients, YCH further expanded our services to include the provision of supply chain management services through a suite of supply chain solutions, namely Intribution™ (raw materials management to support manufacturing) in 1996, Retrogistics™ (service and returns management) in 1998 and Intrabution™ (consumer goods distribution) in 2000.
In 1996, YCH were awarded an Innovation Development Award under EDB's Innovation Development Scheme, for the development of the Intribution™ solution. YCH were appointed by Compaq Asia to implement our Intribution™ solution to service its Asia-Pacific manufacturing operations in the same year. Today, YCH have implemented the Intribution™ solution for our various clients, such as Natsteel Electronics in Singapore and Mexico, Motorola in Singapore and China, Gateway in Malaysia, MiTac in Taiwan and Solectron in Mexico.
In 1999, YCH Logistics Pte Ltd was renamed YCH Group Pte Ltd and presently serves as its holding company.
Currently, YCH can provides both an individual logistics service and an integrated supply chain service, as described as follows:
- LOVA™ (Logistics Value-Added) Solutions
- Warehouse Management
- Inventory Management
- International Freight Forwarding (Air & Sea)
- Bonded Trucking
- Third Party Repair / Materials Recovery Operations
- Insurance Brokerage
- Bulk-Breaking/Re-Packaging
- Cross Docking
Supply Chain Consultancy, Design, Implementation and Operations
Appendix D
Proof of (n>=1) by mathematic induction
When n=1,
=….
=
Assume that when n=k
=
Then the revenue and cost for the customers who entered the company in year k+1 is described as follows:
Revenue
Cost
………..
=
Proof finished.
Appendix E
Data table of retention-NAV model
Formula
+
Parameter variables
Data table