N.B. the opposite also holds true, where a decrease in the price of product y leads to the decrease in demand for product x. A negative divided by another negative results in a positive coefficient.
Take the relationship between coffee and tea. A 4% rise in the price of tea results in a 20% rise in demand for coffee:
XED = % Δ Qd coffee = +20% = + 5
%Δ Pn tea +4%
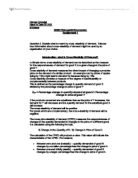
In this case the products are very close substitutes; we can tell this from the sign of the coefficient, which is positive, which tells us that the products are substitutes. The value of the coefficient is highly elastic (XED >1) which tells us that the products are very close substitutes. The higher the value of the coefficient the closer the products are in terms of the utility they provide for the consumer of the products. Graphically the above example would be represented thus:
Take the relationship between chicken and fish. A 10% fall in the price of chicken results in a 2% fall in demand for fish:
XED = % Δ Qd fish = – 2% = + 0.2
%Δ Pn chicken – 10%
In this case the products are distant substitutes; we can tell this from the sign of the coefficient, which is positive, which tells us that the products are substitutes. The value of the coefficient is highly inelastic (XED <1 and >0) which tells us that the products are not close substitutes. The lower the value of the coefficient the further apart the products are in terms of the utility they provide for the consumer of the products. Graphically the above example would be represented thus:
Negative Cross elasticity of demand
Complementary goods have a negative XED. As the price of product y increases the demand for product x decreases:
XED = % Δ Qd x = ⇓Qd x = – = – coefficient
%Δ Pn y ⇑ Pn y +
Take the relationship between airfares and foreign holidays. A 12% rise in the price of airfares results in a 30% fall in demand for foreign holidays:
XED = % Δ Qd foreign holidays = –30% = – 2.5
%Δ Pn airfares +12%
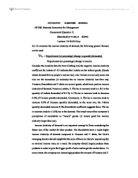
In this case the products are very close complements; we can tell this from the sign of the coefficient, which is negative, which tells us that the products are complements. The value of the coefficient is highly elastic (XED <–1) which tells us that the products are close complements. The higher the value of the coefficient the closer the products are in terms of the support they provide for the to each other in terms of demand. Graphically the above example would be represented thus:
Take the relationship between pens and paper. A 20% fall in the price of paper results in a 5% increase in demand for pens:
XED = % Δ Qd pens = +5% = – 0.25
%Δ Pn paper –20%
In this case the products are complements; we can tell this from the sign of the coefficient, which is negative, which tells us that the products are complements. The value of the coefficient is highly inelastic (XED <–1 and <0) which tells us that the products are not close complements. The lower the value of the coefficient the further apart the products are in terms of the support they provide for the to each other in terms of demand. Graphically the above example would be represented thus:
Zero Cross elasticity of demand
Unrelated products or independent products have a XED coefficient of zero.
Take the relationship between cabbage and computers. A 20% rise in the price of cabbage results in a 0% increase in demand for computers:
XED = % Δ Qd computers = 0% = 0
%Δ Pn cabbage +20%
In this case the products are independent; we can tell this from the value of the coefficient that is zero or perfectly inelastic (XED =0) which tells us that the products are not related. Graphically the above example would be represented thus:
How do firms use XED?
Competition between firms
- When a firm discovers it’s rival firms are producing substitute products to it’s own, the firm can use that information to change it’s pricing strategy for it’s product.
-
If the other firms are producing close substitutes (high value elastic + XED) then the original firm can gain the rival firms market (through increasing it’s own sales) by reducing its product’s price. But will lose market share if it increases its own product’s price.
-
If the other firms are producing distant substitutes (low value inelastic + XED) then the original firm may increase revenue by increasing its product’s price. But will lose revenue if it reduces its own product’s price.
-
If the other firms are producing close complements (high value elastic – XED) then the original firm can expect to gain sales if the other firm reduces its product’s price; therefore the firm may step up production. But will lose sales if the other firm increases its product’s price; therefore it may try to boost sales by marketing e.g. advertising or even reducing the price of it’s product. The strategy would also be influenced by the product’s PED.
Within the Firm
-
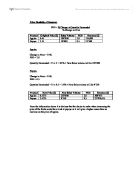
If the firm discovers that two of it’s products are close complements (high value elastic – XED) then it can increase the sales of one product by reducing the price of the other product. If it reduces the price of the cheapest product it will increase sales of the more expensive product and so gain more revenue.
e.g. a firm discovers that the XED between the shoes and socks it sells is – 5.0, this means that a 4% fall in the price of its socks results in a 20% rise in the demand for its shoes.
XED = % Δ Qd shoes = + 20% = – 5
%Δ Pn socks – 4%
If demand for socks remains unaffected by other factors (ceteris paribus) at 100 pairs selling for originally at £6, the original revenue from socks would be £600. After the price fall the price of socks would be £5.76 and the new revenue £576, a fall of £24. The original demand for shoes was 50 pairs of shoes at an average price of £50 per pair, so the original revenue the firm gained from sales of shoes stood at £2500. After the price change of the socks, demand for the shoes increased by 20%, i.e. sales rose to 60 pairs and revenue increased to £3000, a gain of £500. So by reducing the price of the cheaper product the firm increased its revenue by £476 (£500 – 24)