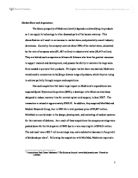
Figure 1: Debenhams PLC share price from 2009 to 2011
Source: FT, 2011a
FTSE 100 Index
As the same period as Debenham’s financial year for 2009 and 2010, the average index of FTSE 100 was 4422 in FY2009 while it increased by 28 percent to 5669 in FY2010 (London Stock Exchange, 2011). Similarly, Figure 2 indicated that FTSE 100 Index increased nine
percent in 2010 compared to 2009.
Figure 2: FTSE 100 index from 2009 to 2011
Source: FT, 2011b
Overall, Debenhams share price seemed to reverse the trend of FTSE 100 and it showed the negative grow in the year 2010.
Department retailer sector
With regards to the annual sales change of department retailer sector, it showed upward trends both for 2009 and 2010 by 1.5 percent and 8 percent, respectively (Mintel, 2011). It showed that the trend of Debenhams share price and the sales of department retailer sector have the opposite movement. In general, the trend of Debenhams’s share price has the contrary trend of FTSE 100 index and the sales of department retailer sector.
Ratio of Dividend Yield and Dividend Cover
The definition of dividend yield ratio is the way to measure the cash return from a share in the market (Atrill & Mclaney, 2010). In terms of dividend cover ratio, it is the proportion of earnings that an organization pays out to shareholders in dividends (ibid). Regarding to the ratio of dividend yield, dividend cover, it is noticeable that the dividends were not issued to shareholders in FY2010. Therefore, dividend yield and dividend cover for 2010 are not available (N/A). After 2008 banking crisis, department retailers faced the severe challenges. Non-dividend is caused by Debenhams’ financial were unfavourably influenced by purchasing Debenham's its own merchandise instead of moving space away from concessions (Bond, 2010). Thus, the board of directors of Debenhams decided not to release dividends. However, Debenhams has successfully refinanced £650m of debt in 2010 and the interest fees are set to fall from 7% to 4.5%. Analysts indicated that this could lead to the company paying dividends again in 2012(Fletcher, 2010).
Reference:
Atrill & Mclaney(2010) Acounting and Finance for Non-Specialists. 7th ed. Essex: Prentice Hall.
(2010) Debenhams faces shareholders' wrath at AGM [online]. Tue, 12th January. Available from: [Accessed 21 Nov. 2011].
Financial Times (2011a) Debenhams PLC Market Data [online]. Available from: [Accessed 21 Nov. 2011].
Financial Times (2011b) FTSE 100 Index prices and performance [online]. Available from:
[Accessed 21 Nov. 2011].
Flecter (2010) Debenhams edges higher as it refinances £650m of debt [online]. Mon, 19th July. Available from: [Accessed 21 Nov. 2011].
London Stock Exchange (2011) FTSE 100 [online]. Available from: [Accessed 21 Nov. 2011].
Mintel (2011) Department Store Retailing - UK - March 2011 [online]. Available from:
[Accessed 23 Nov. 2011].