1.1) Shift in Demand
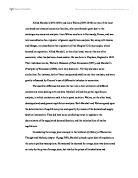
Shift in demand can be referred to a factor that causes the demand curve for product X to move either to the right or to the left.
Price
Of X Decrease
Increase
P1
D1 D2
0 Q1 Q2 Quantity of X
demanded per time period
Baumol.W, Blinder.A (2007)
Let’s take the product X to be salmon.
- Shift to the right from D1 to D2 means demand has increased at the given price for e.g. at price P1 the demand for salmon increases from Q1 to Q2.
- Shift to the left from D2 to D1 means demand has decreased at the given price for e.g. at price P1 the demand for salmon decreases from Q2 to Q1.
For e.g. Albion café in Shoreditch east London is the only British café serving English breakfast in that area as the demand for there food increases prices also increased because of no competition.
Factors that can affect hospitality industry:
-
Price of the substitute product: For e.g. In our restaurant substitute for Dover sole is skate or halibut.
But due to off season we don’t receive skate and few pieces which we receive are sold at higher rate because of which the demand for Dover sole has increased which can be readily show in the diagram the shift from D1 to D2.
-
Fall in the price of the complement in consumption: For e.g. our restaurant buys berries only for jams and compote and sugar to make it, so berries and sugar are complemented by each other and there was drop in the price of berries due to seasonal availability so it encouraged us to make more conserve which increased the demand.
-
Rise in income: it can be stated that if there is rise in income more money is to spend and demand for certain product can increase.
-
Taste: In our restaurant flavor of the soufflé changes seasonally, but a popular flavor is often kept on the menu which increases the demand of that fruit.
-
Advertising: Chateau boundary is the program launched by our restaurant to promote wines from chardonnay which ahs increased demand for white wine from D1 to D2.
2) ELASTICITY OF DEMAND.
Price elasticity of demand is used to show the relationship between the numbers of goods or services demanded which shows effect on increase or decrease of the price. This can be used in making decision regarding price of a particular product. It can be described perfectly with help of formula:
PED = (% change in quantity / % change in price)
Mankiw.G, (2008)
For e.g. Westfield is the mall in shepherds bush with number of food outlet and fast food chain to survive in that market they try to be as competitive on pricing and there is demand for average price meal which can be consumed quickly because people come there to shop rather than Michelin style food. So the outlet owners need to change there price according to the demand.
Bighospitality.co.uk.
Price elasticity of demand depends on number of factors:
-
Availability of substitute in consumption: If substitute is available more closely to each other in the market, the elasticity of demand will be response to change in price. E.g. Starbucks are market leader in wide range of coffee but a premium rate to get into this market McDonalds has started making coffee at cheaper price than Starbucks and many of the customer have switched to McDonalds because of price of the coffee.
The telegraph
-
Necessities and luxuries: Necessities demand curve are more inelastic in nature whereas luxury demand curve are more elastic in nature. For e.g. vacation airline ticket would be more elastic rather than business tour airline ticket which would be inelastic in nature. Expensive champagne would be inelastic in nature whereas demand for normal daily wine would be more elastic.
-
Available amount of income to spend on goods: It is the factor which is referring to total money spend by a person on a particular goods or service. For e.g. if a person drinks four coffee in a day (coffee is for 1 pound a cup) its price goes up by a pound and his income stays the same the money to spend on four coffee is now only for two coffee, as a result of this customer is forced to decrease his demand because of increase in price, to conclude we can say demand is sensitive to price.
-
Time: Demand tends to elastic in long run than shorter run. For e.g. prices of oil went up but there was no substitute other than consumption at given price but over the period of time there was ways found to less consumption of oil products which are better mileage car, spending more money on the insulation of houses.
-
Habits forming goods: Goods such as alcohol and drugs are inelastic in demand, irrespective of the price change the consumer tend to buy the product.
2.1) Cross elasticity of demand
It measures the responsiveness of demand for a product to change in price to other related product.
CED = % change in QD
% change in price
Parkin.M, (2008).
For e.g. In our hotel there is roof top restaurant which does not take booking for lunch or dinner at busiest time of year which indicates that price is inelastic when demand is there, but during slag time we taking booking for party or table booking and price change due to demand.
2.2) Income elasticity of demand.
It measures the responsiveness of demand for a product to change in income of the person demanding goods, holding all prices to be same. It all depends on the nature of the goods for e.g. if it is necessity good then person will buy it and will cut down on luxury goods if the income is low of that person.
IED= % change in quantity demanded/ % change in real income.
Fair.R, Case.K, (2008).
2.3) Total Utility:
The total satisfaction gained from all unit of a particular commodity consumed over a period of time is called total utility. For e.g. a person gains 50 utility of total utility when he consumes a egg. This total utility is sum of utilities of successive units, for first egg 35 utility, 15 for second egg and 5 for third egg. It is the sum of marginal utility of each successive consumption of unit which can be derived in formula as shown below:
TUx = ∑MUx
Baumol.W, Blinder.A, (2009).
2.4) Marginal Utility:
Marginal utility is the change in satisfaction from the consumption of one more unit of a good. For e.g. when consumption is increased from one to two the utility is increased from 30 to 45 utility. It can also be described as difference between total utility derived from one level of consumption and total utility derived from another level of consumption which can be derived in formula as shown below.
MU = ∆TU / ∆Q
Baumol.W, Blinder.A, (2007).
This table shows that total utility will increase at a much slower rate and marginal utility diminishes with each additional chicken.
2.5) Law of diminishing marginal utility
The more an individual has of a product the less of an additional utility will be gained from each extra unit is consumed. It helps economists to understand the law of demand and the negative sloping demand curve. The less of something you have, the more satisfaction you gain from each additional unit you consume. Prices are lower as higher demand is there because satisfaction diminishes as you demand more.
Hirschey.M, (2009).
3) PESTLE ANALYSIS:
It is scan of business environment, it is the analysis of business environment which is out of control but can be kept in mind while doing product development or strategy planning.
Companies use this tool to analyze the macro environment and making sure that they are aligned positively with the forces of change that is going to affect there business. If PESTLE analysis is done perfectly it will help avoiding the step that could lead to failure for reasons that are out of your control.
- Economic and government policy are closely related to the business as this affects the business very much and changes other factor as well, economic condition also show how easy or difficult is to operate and how much is the demand or profit going to be made.
- Sociocultural environment comprises of demand and taste which can vary according to trend and fluctuation of income.
- Technology is basically used for organization competitive advantage, but by emergent of new companies could pose a threat to existing industries which can make it technology rendered redundant or out of date.
- Legal and environment are both equally important as changes in legislation could affect the employment demand and quotas and ordering of goods. Environment as most company are doing something or the other towards environment and being socially responsible.
COLLINSON.S, RUGMAN.A, HODGETTS.R, (2006).
3.1) PESTLE for THE BOUNDARY HOTEL:
Sociological/ environmental factors: The trend towards cost effective business travel needs which result in more value for money, which is where our value added service and value for money plays a vital role which puts us apart from the rest of the hotels and most of our customer are from corporate and business world whose spending power is big and they tend to be our target market. Personal selling has resulted an increase in awareness among local community and corporate world.
As consumer and government are aware of the impact of the businesses on environment, so in terms of environment we have drilled two ‘green’ bore holes and now help to run most of the mechanical plant. Green technology has resulted in 20% power save over last year. (According to European journal of marketing).
Technological factors: The installation of “onboard” reservation system which is directly connected to the travel agents and the airline reservation system which has resulted in increase of business and demand for room has been increased.
Each guest bedroom has access with wireless and high speed internet through cat5 cable which is our unique selling point with 32’’ flat screen TV with complete AV equipment.
Economical factors: The recent recession has resulted in many smaller hotels to go into liquidation as they do not posses the infrastructure to support underperforming properties as the larger chain does and because of this inflation rate has gone higher which has affected the spending power of the people. www.bbc.co.uk
Credit crunch has also affected our organization as the room rate has gone down by approximately 30% as spending power of clients have gone down as a result it affected us positively by attracting more guest. Favorable exchange rate has resulted in increase of travelers in London and cheap package deals as well. www.bighospitality.co.uk
Cancellation of London fashion week has resulted in loss of business clientele which has seen drop in sales.
Political / legal factors: Minimum wage has increase from 5.80 GBP to 5.93 GBP which makes it compulsory for the hotel to pay to there employees.
Taxation policy has affected a lot because of increase in the VAT is directly affecting the cost of the product which has limited the spending power of the people and affecting our sales negatively.www.bighospitality.co.uk
Political issues affecting the business is ensuring all licenses required are put into places, this include opening and closing times of facilities, health and safety –fire exists. www.directgov.uk
Summary:
From the above pestle we can clearly see that political and sociological factor are the major factor influencing demand as VAT has increased and because of economic crises people tend to spend less money and on the other hand technological development is trying to clinch remaining percentage of business clientele and leisure guest which our hotel has succeeded in doing this on the basis of new onboard technology and effective marketing which has seen increase in demand.
4) SWOT ANALYSIS:
It is the strategic tool used by the business to know strengths, weakness, opportunities and threats to achieve business objective and to know internal and external factor which may be favorable or unfavorable to achieve that objective.
SWOT analysis group key pieces of information can be categorized into two:
- Internal factors: strengths and weakness internal to organization.
- External factors: opportunities and threats that is present in the external environment of business.
The use of SWOT is not only limited to profit making organization but can be used to achieve desired objective which include non-profit organization as well. Internal factor which include personnel, finance, and capabilities. External factor which may include macro environment such as political, social, technology and environment.
4.1) SWOT for THE BOUNDARY HOTEL:
STRENGHTS
- Newly renovated 10 suites which are costing around 1,100,000gbp.
- Close to good attractions and market such as London Bridge and spitalfields market which is approximately 10 minutes walk.
- Each room with unique design and space of around 37 sqm of each room.
- 3 different restaurants with 3 different cuisines in house provide the guest with ultimate food experience.
- Renowned brand of 51 restaurants and 1 hotel which come under D&D groups.
- Green technology has helped us in cutting the power usage by 20%.
- Sales generated through social networking sites such as facebook and twitter is almost 4% of the overall sales.
- Non smoking floor with 5 suites and 5 basic rooms.
WEAKNESS
-
Online sales contribute only 4% to overall sales.
- As it is a new hotel brand awareness level is about 42% as
compared to crown plaza which is 75%.
- Customer complaints have increased by 8% as compared to last year.
- Market share has drop by 1% as compared to last year.
- Staff turnover 58% as compared to last year.
OPPORTUNITIES
-
Joining the design hotels.
- Using the high profile events such as London fashion week
and east London design show to increase awareness and brand value.
- Introducing IMAC technology in suites.
- Improvement in the strength of traveling market.
- No direct competition in terms of ‘5 star’ boutique property.
THREATS
- Saturated boutique market.
- Easy to enter a market.
- Recovery from recession may take time.
The boundary hotel Brochure
Summary
If we see at the strengths of the hotel it can clearly seen that due to its location and excellent social media marketing hotel demand has increased but it lacks recognition as compared to neighborhood hotel crown plaza whose brand image is higher than boundary hotel and due to which demand decreases sometime due to lack of brand recognition. But if we take advantage of high profile events such as London fashion week and designer show where we can market our product and increase our demand in high socialites.
Bibliography
Books:
-
Ian Worthington, Chris Britton (2009). Business environment. 6th ed. UK: Pearson. p4.
-
Sloman.J (2006). Economics. 6th ed. UK: Pearson. p10.
-
Parkin.M (2008). Business and Economics. 6th ed. UK: Pearson. p36.
-
Fair.R, Case.K (2008). Principles of Economics. 6th ed. UK: Prentince hall. p57.
-
Rugman.A, Collinson.S, Hodgetts.R (2008). International Business. 13th ed. UK: Pearson. p373.
-
Baumol.W, Blinder.A (2007).Microeconomics, principles and policy. 11th ed. USA: Cengage learning. p116.
Web-sites:
-
(2008). Millennium records a small drop in demand. Available: http://www.caterersearch.com/Articles/1998/08/13/13111/Millennium-records-a-small-drop-in-demand.htm. Last accessed 21/01/2011.
-
Paskin.B. (2010). Recession ends but hospitality insolvencies rise .Available: http://www.bighospitality.co.uk/Trends-Reports/Recession-ends-but-hospitality-insolvencies-rise. Last accessed 25/01/2011.
-
Paskin.B. (2008). Fifty restaurants unveiled at Westfield London grand opening . Available: http://www.bighospitality.co.uk/Venues/Fifty-restaurants-unveiled-at-Westfield-London-grand-opening. Last accessed 27/01/2011.
-
Pym.H (2010). Where the recession has hit hardest. Available: http://news.bbc.co.uk/1/hi/business/8320631.stm. Last accessed 15th October 2010.
-
(2010). national minimum wage. Available: http://www.direct.gov.uk/en/Employment/Employees/TheNationalMinimumWage/DG_10027201. Last accessed 16th October 2010.
-
Eversham.E (2009). Hoteliers drop room prices by 12% to attract guest. Available: http://www.bighospitality.co.uk/?page=articles&ID=203177. Last accessed 24th October 2010.
-
Paskin.B. (2010). Absorb the VAT increase, consumers tell business. Available: http://www.bighospitality.co.uk/?page=articles&ID=204423. Last accessed 24th October 2010.
Newspaper and Journal:
-
Wallop.H. (23rd Sept 2010). McDonald's now biggest seller of coffee in UK. The Telegraph, p4.
-
Foley.A and Fahy.J (2009), ‘Commentary: Seeing marketing orientation through a capabilities lense, European Journal of Marketing.