The choice of tools used concerns the project objectives and were chosen in a way they would aid the improvement programme and achieve the set goals. As quality is driven by internal capabilities, but perceived externally by customers all relevant company processes needed to be looked at. The questionnaire was used to understand to recognise, what consumers thought Enterprise Rent-a-Car’s strengths and weaknesses were. The flow diagram was chosen to realise the process of renting a car in order to identify critical activities. The Critical to Quality (CQT) tree was utilised to provide knowledge on the essential output characteristics of the process. The fishbone diagram was employed to analyse the origins for the given problem with the Pareto chart examining the leading causes for customer dissatisfaction. The value chain was chosen, because it highlights the firm’s internal copetencies and capabilities, identifying possible areas of improvement. The affinity diagram was used to, again, understand root causes for problems, but also come up with solutions, using brainstorming. For the control stage, two methods were used. Both the PDCA model and the balanced scorecard were taken aboard, because they provide information on both internal and external sources of quality issues, whilst giving clear indication of future action that could be used the address them.
As the report aims to improve the issues surrounding customer satisfaction, as well as drive performance, using the abovementioned tools, the company is analysed methodically using the DMAIC framework, providing clear deliverables stated in each phase.
Part 2 Define Stage
- Flow Diagram
A Flow Diagram or process map is a critical tool in the Define stage of the DMAIC process. They show the sequence of all activities involved in the process and additionally, help identify where quality-related measurements should be taken (Evans & Lindsay, 2011). According to Basu (2004) the benefit of using this particular tool helps the team understand and agree upon the steps of the process and recognise improvement opportunities. For the length of the customer service process, amongst the different process followed for different types of customer, to build a diagram to differentiate the initial customer service process and front line customer service process can assist us further on in the measure stage. Backline service isn’t insignificant, but more so it overlaps with the initial front line and in-house customer service process. Backline service is much to do with selecting, allocating and cleaning the customer’s car which is covered in both mentioned customer service processes.
For building the Flow Chart, the Basu’s (2004) framework and method, combined of:
- Process selection and setting the boundaries.
- Determining activities and steps of the process.
- Arranging the order for the process.
- Drawing out the diagram.
The symbols used in the drawing process are:
- Oval – showing the start and end of a process.
- Rectangle – showing an activity in a process.
- Diamond – showing a point where a decision needs to be made.
Additionally, in a theoretical sense, a circle is used to show, where a break from the diagram occurs, connecting to another part of the diagram.
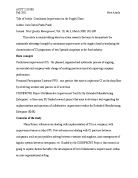
The initial reservation process diagram in figure 1 below details the process from the customer’s enquiry to booking the reservation through to confirming details over the phone. When receiving a customer inquiry, usually the customer has an idea of what size of vehicle they require, but it is important the employee can guide the customer towards fulfilling their requirements. Enterprise employees are requested to not pressure sell in an effort to not comprise customer service standards. However, to be able to upgrade the customer it is questionable how to strike the balance between offering unquestionable service and generating more revenue from a sale.
At this stage there is only verbal communication between employee and customer. If all details are collected correctly the reservation should be saved with the customers details. There are specific flaws in this process from giving the customer a quote over the phone as this quote is not inclusive of excess protection (which is described later in the process, in-house front line service.) Therefore, the customer is unaware when they complete the reservation over the phone of the limited insurance cover they have and the £500 excess they carry. The fixation is on securing the reservation; therefore front line employees may be more reluctant to discuss the insurance cover with the customer, unless the customer specifically asks. If the customer then decides to confirm the reservation, the employee needs to ensure he/she explains all documents to the customer and confirms their age is over 25. Forgetting to ask these questions/specify these documents can result in a customer walking into branch and being turned away when they were insufficiently informed.
Figure 1:
Figure 2:
The second flow diagram illustrates the face to face customer contact, the secondary element of the front line service procedures. The report will only be dealing with the front line service environment, as the backline service procedures are insignificant to our customer service improvement model. This is the process when most customer service improvements can be identified. The speed of the process is key to customer satisfaction, they shouldn’t have to wait to have their car cleaned, this should be done before the customer enters the branch. Secondly, employees should also be knowledgeable within their roles to ensure the customer is made aware of their insurance policy on the vehicle.
- Fish bone diagram
Research suggests the most appropriate tool to evaluate the most likely causes of customer dissatisfaction throughout the initial customer service process and front line service contact process. This particular tool is therefore beneficial to the define stage of our performance evaluation as assumptions are made to the key determinants of customer satisfaction, the measure stage can then consult how far front line service employees deviate away from these indicators and offer relevant solutions to control.
Manpower
Machine
Material
Inadequate training
Authority
Reliable computer
Reservation booked on wrong day
Did not select pick up option-customer left waiting
Check list of correct cars to correct customers
Recording Method
Clear/Consistent instructions
Car rental booking system
Customer Feedback
Monthly ESQI Score
Branch Rating
Damage to vehicle assigned to rental customer
Reliability
Monthly
Dissatisfied customer
Method
Mother Name
Measurement
According to Basu (2004) and Evans (2005) The fishbone diagram, or alternatively the cause-and-effect diagram, is a useful and commonly used tool for identifying the root-causes for a given problem. The tool was devised by Kaoru Ishikawa. The diagram represents graphically the chain of causes and effects (Evans, 2005). The problem is usually placed on one side of the diagram with the causes forming the structure of fishbone. The diagram is usually built through an exercise of brainstorming for everyone to be able to contribute.
The Black belt leading this report who covered a four month internship with Enterprise has used past experiences to develop the main areas specified in the cause and effect diagram below. There are many reasons which lead the different causes identified to result in a dissatisfied customer walking out of the branch. These can include:
- Incorrect car to incorrect customer
- Late vehicle delivered to customer
- Unclean car
- Incorrect class of car
- Damage to vehicle affecting customers driving experience.
These particular reasons are addressed in out questionnaire design and therefore form our generic effect of a ‘dissatisfied customer.’ It is therefore important to use this particular tool within the define stage of our report, as it can be used to identify the main causes which led to our questionnaire formulation, desigining specifc questions to prompt indirect judgements on these particular causes and further be able to rate these and create a more solid, quantitative guideline on the most frequent cause, presented in a Pareto chart in figure 1.9.
The cause and effect diagram can be applied on a wide basis to the organisation. It would be possible to complete a cause and effect diagram for several issues affecting customer satisfaction. For example, incorrect car to incorrect customer, is an issue that can arise from the effects of mother nature, such as a car assigned to a rental customer and when returned by the previous customer it is late or majorly damaged and unable to rent. In effect, the company not only dissatisfy that customer, but also lose money and this is an issue that is out of the organisations control.
It is important for employees to be familiar with this measurement tool for customer satisfaction, to be able to identify particular factors that result in dissatisfied customers.
Each effect has a particular impact on the next. For example, staffs that are new to the company would have received initial training before their introduction but would also be expected to learn the majority of their duties on the job. Hence when dealing with the ‘machine’ in this case the computer reservation system, whatever they input may not be accurate or complete, as they are still unfamiliar with the system. Secondly, assistant managers who produce the checklist of vehicles against clients for the day, rely upon reliable information received from the other employees. Ultimately this is a vicious cycle, affected by the accuracy of the method used to record the reservation alongside manpower and machinery.
- CTQ Tree (Critical to Quality tree)
To further investigate the basis of customer satisfaction, a CTQ tree can be used to narrow down the primary areas of concern. We are now leading our report in this particular direction to hinge in upon these areas in the analysis stage and evaluate how effective they are in practice and as thought by our sample who participated in our questionnaire. The data again was based on previous experiences and knowledge of our Black belt’s former work experience and from discussions with a management trainee at a local midland branch who suggested the particular areas studied in our CTQ as areas of potential improvement, as these areas form the foundations of the company.
The CTQ defines the critical output characteristics of the car rental process that result in customer satisfaction or dissatisfaction. The subsequent stages follow a structured methodology and expected quality standards (Basu, 2004). The general needs identified in level 1 also relate to the questions adhered in the questionnaire, both are aligned towards the attributes of the service; critical to the customer. Level 2 goes through the same thorough analysis of the customer service process as the questionnaire, i.e. speed of the process, quality of the vehicle and knowledge of the representatives form the primary targets of the customer service process. Level 3 then presents a more detailed overview of the factors effecting the success of level 2, i.e. speed and accuracy of the check in and checkout process, meeting the consumers’ expectations and at their convenience and secondly, the quality of the vehicle, whether it matches required specifications. Finally, it deals with the knowledge of the representatives, their ability to answer questions with well-trained responses and sufficient knowledge of the product and service. Consequently, from satisfying each individual critical to quality factor, Enterprise Rent-a-car can limit the customer gap between expected and perceived quality.
Part 3 Measure Stage
- Questionnaire
Questionnaires are a method used to carry out primary research, they can prove to be essential when organisations seek to improve their customer service. In relation to enterprise rent a car, a questionnaire provides us with the opportunity to gain a clear insight and understanding of the experiences our customers have had. Through this we shall aim to determine if there are any direct links between their experiences and a given process in the customer service cycle defined in part 2. Through the questionnaire we shall attempt to identify the areas which are causing dissatisfaction amongst our customers.
- Parteo Analysis
The Pareto Chart is named after the italian economist , Vilveto Pareto, who believed that a large share of wealth is owed by a small percentage of population or 80 percent of the effect are caused by only 20 percent of the causes, which in principle could be successfully implemented to distinguish quality problems. Pareto Analysis is seen as an effective statistical technique to distinguish the most important problems first . these are also known as the vital few over the trival(useful) many.
In Pareto Charts the bars are arranged in a decending order from high to low. Or the bars on the left side of the Pareto chart are relatively more important than then those on the right. Pareto chart has the ability of classifying the queries which have a greater cumulative impact on the system used. This tool, gives a better understanding of the problems, it devides it in small parts in order to focus on the most important issue as well as gives a great opportunity of using limited resources in the company’s advantage. (Basu, 2004). The benefit of this particualr tool gives us a better picture on what was most important to costumers and how that could be improved in order to increase their expectation as well as to be classified as a company with a high level of costumer satisfaction.
To create this pareto chart primary and secondary data was used. One of the most important data used were the questionnaires. Observations and personal experience were also used there. Because of this pareto chart we were able to prioritise the issues that were causing most of the problems. Moreover our main improvements were directed straight to these priority areas wich would consequently have a greater impact.
Figure1.1
( By the help of the books was done in excel, not a copy)
This is a classic Pareto result with a 80% split in favour of two primary performance indicators.Figure 1.1 illustrates that the main issue experienced by customers throughout the process was the lack of feedback option. This was particualry suprising to us as it is not necessarily an immediate service issue that customers would have picked up on. In this instance a feedback option can mean an option to provide written feedback to Enterprise staff on a branch level instead being redirected to issue complaints to head office. The company actually had a feedback leafleat ,which is however, only composed of two questions. Moreover the fact of non having a more useful detailed and an incentive to complete a feedback option, is in companies disadvantage.
The secondary indicator was the issue of hidden charges and cost toward over what was declared over the phone or on the website. Commonly people want to pay what they have heard of, and through our research and thorough analysis it resultyt that a lot of customers have actually experienced planty of hidden charges in the car, from insurrance problem, to mechanical problems that the car itself experience, which customers had to pay. Secondary problems included wrong car specifications given and poor check in and check out processes . Therefore, there needs to be more attention among the Enterprise rent-a-car team towards improving the customer gap.
Part 4 Analysis
4.1 Value chain
It is important to conduct further analysis of the firm’s infrastructure and the foundations upon which the customer process is built to evaluate how successful the firms activities support the companies mission statement. “Porter’s value chain has been a keystone of strategic analysis” (McPhee and Wayne et al, 2006). It looks at how core functional activities of the firm add value to the company. All activities are interconnected and the value chain analysis is inwardly looking. The value chain identifies the effectiveness of all core and supporting activities which determine the company’s competitive advantage. From a resource based view this is determined by the valuable nature of resources that place pressure on competitors (Prajogo et al, 2008).
4.1 Internal Analysis-Value Chain
INBOUND LOGISTICS
The service of Enterprise from a paper based perspective is built up as the competitive advantage of the firm. However, from the measure stage we have ascertained that customers would like a better immediate feedback facility and be better informed of all charges. This points towards better sales and service training for new employees especially to improve this aspect of front line service quality.
FIRM INFRASTRUCTURE
HR MANAGEMENT
TECHNOLOGY DEVELOPMENT
PROCUREMENT
OPERATIONS
OUTBOUND LOGISTICS
MARKETING & SALES
SERVICE
MARGIN
The firms infrastructure forms the entire building blocks of the company. The general management stabilises the firms activates and guides further operations. Each enterprise branch consists of an assistant manager and manager who control the company fleet and report to head office. The branches are the bricks and mortar of the company. It is the quality of customer service delivered throughout these branches that form the key source of competitive advantage for the firm and support its reputation. All elements of operational planning are managed in-house, each branch must know which car is assigned to each customer and all the elements of the flow diagram discussed in the define stage are planned throughout every branch on a daily basis. Throughout this operational scheduling, each process should be subject to quality management. Quality management is a source of continuous improvement and from the pareto analysis in the measure stage, we can see that the most common source of customer dissatisfaction within branches was the lack of immediate feedback option. Which is potentially a result of the second most common problem hidden charges.
Human Resources is also a key element of competitive advantage as it is the employees recruited by the firm that determine how successful they satisfy their mission statement, “customer service is our way of life.” The training of new recruits also has a significant impact on the customer satisfaction. As the Pareto analysis demonstrates the other primary sources of customer satisfaction are receiving the correct car group and specification of vehicle of which stem from employees insufficient on the job training. Enterprise Rent a Car have a large recruitment pool and all new employees predominately rely on branch training this therefore has consequences for customers who are usually subject to their mistakes.
Technology development is applicable to the computer reservation system used by Enterprise Rent a car. The two primary systems used ERAC and Ralph add different capabilities to the firm, but must be used simultaneously to be effective.
Procurement is the purchase of assets, in this case the enterprise vehicles which enterprise purchase to increase their fleet. Each vehicle will not yield a high level millage and will come from approved suppliers such as Vauxhall to add value to the company’s asset sources.
Outbound logistics involves the customer receiving their car. From the measure stage we can ascertain that when collecting the car, the customer can experience problems from hidden charges to wrong specification of vehicle.
Marketing particularly is based on word of mouth from the perceived level of customer service to be received from their reputation and mission statement. But also from the main causes of customer dissatisfaction detailed this form of advertising can also work two ways.
Receiving the customers call
Operations involves processing the reservation, here mistakes can occur, as new employees get to grips with the technology.
Each element of the value chain equally supports the customer service process and all core functions and supporting activities rely upon all maintaining consecutively high standards. The firms infrastructure, which encompasses the entire company from general management to operations relies upon highly talented and well trained employees who are successfully trained in all technological equipment of the company to be able to sufficiently provide consistently high customer satisfaction. We have already outlined in our problem statement, point 1.1 and further in our objectives that employees are key resources to the business who require better initial training before entering the branch. The measure stage outlines the apparent issue of ‘hidden charges for customers’ this could most likely be caused from new employees misunderstanding the specific charges relevant to the three different types of customers dealt with within branch; retail, insurance and corporate customers. Or their lack of understanding of the technology used to process reservations means the norm of in branch training for employees can result in problems and require the customer’s patience.
Part 5 Improve
From the value chain analysis, we can ascertain particular sources of improvement:
- More training for new employees within head office before entering the branch to have sufficient knowledge of the reservation process.
- Employees work an average of a 50 hour week, which could impact how likely employees are willing and able to offer a repeated great level of customer service. Therefore, implement more staff within branches to spread out the work load. Resulting in short term costs for the company, but long term gains in competitive advantage.
- There are already established benefits for great sales, but applying separate rewards for great customer service, measurable on a branch level could further motivate employees.
- Necessary to collect feedback at the point of return, i.e. the vehicle check in process.
- Feedback forms given with the contract.
The use of an Affinity diagram is effective at this point in our analysis to brainstorm the root causes and solutions to the dilemmas identified. The first stage is to brainstorm ideas that are relevant to the problem statement. These ideas are randomly generated and therefore follow no initial pattern. Ideas are then sorted into relevant themes and finally these themes are appropriately categorized and from this solutions can be suggested.
5.1. Affinity Diagram:
Staff work too many contracted hours and additional overtime
Lack of unity between performance metrics for selling and for offering good customer service
Two technological reservation systems to deal with
De-motivated by salary
Lack of training before entering branch
No fixed reward scheme for offering brilliant customer service
Pressure to sell add on products
Staff are unmotivated
Pressure from managers to perform on every level
Staff are unmotivated
De-motivated by salary
Staff work too many contracted hours and additional overtime
Lack of training before entering branch
Two technological reservation systems to deal with
No fixed reward scheme for offering brilliant customer service
Lack of unity between performance metrics for selling and for offering good customer service
Pressure from managers to perform on every level
Pressure to sell add on products
Organisational culture
Staff are unmotivated
Lack of training before entering branch
Two technological reservation systems to deal with
HR issue
Lack of standardisation
De-motivated by salary
Staff work too many contracted hours and additional overtime
No fixed reward scheme for offering brilliant customer service
Pressure from managers to perform on every level
Lack of unity between performance metrics for selling and for offering good customer service
Pressure to sell add on products
Why are there deficiencies in the customer service process? Figure 1 .3 Brainstorm ideas
The common issues that were derived from our analysis are now cemented in stage 3 of the affinity diagram. The problem statement can seem broad, but this has enabled us to reveal three reoccurring themes that have arisen as potential causes of the deficiencies in the customer service process. The first two recurring themes, organisational culture and human resource issues are more aligned towards work and psychology. Staff appeared de-motivated by pay and working hours and face extensive pressure from managers to perform on every level, to exceed their sales figure but deliver uncompromising customer service. Alongside, a lack of incentives to perform beyond the expectation. With such a strong culture towards selling add on products, the organisational culture Enterprise adopts in branch and the vision displayed to its customers and stakeholders of great customer service, lacks uniformity both internally and externally. This leads into the lack of standardisation and the mixed signals received by employees who are faced with two very different performance metrics, that of exceeding sales figures and delivering excellent customer service.
Part 6 Control
Now we have identified the main performance indicators, it is effective to implement an action plan to improve upon current performance. Therefore, it is beneficial to use a PDCA tool to illustrative corrective steps to be taken. The Deming Cycle is a tool used by many as method in which to gain a clear understanding about a given process or service. The PDCA model is made up of the following stages, PLAN, DO, CHECK and ACT. The model is drawn in such a way that it implies the sequence of steps be repeated, in an improved manner (Henry R. Nerve, pg42). This is conducted by examining the knowledge gained in the previous steps.
6.1 PDCA Model
The Deming Cycle is a tool used by many as method in which to gain a clear understanding about a given process or service. It is imperative that whilst it is theoretical based, therefore requiring the input of data in order for an analysis to be carried out at each stage, we must pay close attention to the way in the practicality our data gathered.
The PDCA model is made up of the following stages, PLAN, DO, CHECK and ACT. The model is drawn in such a way that it implies the sequence of steps be repeated, in an improved manner (Henry R. Nerve, pg42). This is conducted by examining the knowledge gained in the previous steps.
The use of this model emphases the significance of carrying out certain stages i.e. DO stage on a small scale, however large enough to gain useful information, but no larger than necessary in case things go wrong (Henry R. Nerve, pg142).
Whilst various founding’s can be derived from each stage, the ACT stage of the PDCA model is imperative to summarise as it determines what to do next. For instance, to adopt a change, abandon the plan altogether or to run through the cycle again. (Henry R. Nerve, pg142). In conclusion Edward Deming’s work is fundamental to improving and controlling the process or services within a business as it focuses on something, which clearly makes sense, yet many simply fail to follow. (Henry R. Nerve, pg142).
Enterprise rent a car is a large company with many outlets, which are aimed at meeting the needs of the local community whether it is for a business or leisure trips. With the mission statement of the company being ‘customer service is our way of life’, it is essential enterprise adhere to this in every possible way. It is essential all members of staff have a good level of morale and remain motivated through their time with enterprise to ensure maximum efficiency of output is obtained to offer the best possible customer service.
The PDCA model can be applied effectively here as many members of staff feel they are under immense pressure from managers to perform and there is no fixed reward scheme for offering brilliant customer service as illustrated in 2.0 affinity diagram. These are major factors in relation to employee de-motivation and morale. Many of the flaws in the car rental industry are down to a poor process internally or a lack of attention from members of staff. The four stages of the PDCA with careful execution can help eliminate problems and help improve the customer service issue enterprise is currently facing.
During the plan stage it is crucial, enterprise implement employee leadership programmes to help equip employees with the necessary tools to become leaders within their own job roles. This will not only help improve employee morale but improve the service that is provided to their customers. A leadership programme that incorporates a ladder to success, clearly defines at each stage what is required to move onto the next level and the incentives of career progression. i.e. higher pay, lower discounts rate for employees and responsibility of subordinates will help increase motivation. This can be applied to the PLAN stage of the PDCA model.
The next stage DO is imperative; through quality Circles employees can discuss the effects of the leadership programme, and highlight any areas of concern they maybe having whilst taking the programme. This is an important step in moving forward collectively as company. At this point employees may show resistance to change, which enterprise must meet head on by reinforcing the benefits of the leadership programme and assuring the safety of jobs. Reference (west, 2004).
The CHECK stage provides the opportunity to evaluate how employees are finding the programme overall using a performance matrix, and if any improvements have been made regarding employee motivation and morale. This would be most effective should the data obtained be quantitative to ensure a clear conclusion can be found for future reference. To make the project manageable enterprise should seek to try the programmer in a few branches initially. If successful then implement the programme nationally, however should no improvement be made then running through the cycle again and perhaps altering the plan may prove to be effective
6.2 Balanced Score Card
The balanced scorecard is an approach that aims to generate growth and learning and develop value-added services to customers. It is a framework with the objective of translating strategic objectives into performance indicators across four perspectives – the financial, customer, internal business processes, and learning and growth perspective (Basu, 2004). The company can manage and sustain its current performance as well as use it as a means of seeing how well it is achieving it vision and long-term goals. The KPI-s are used as a dashboard – when the company achieves its target value, it is shown as green. If the target isn’t achieved but is in a in the tolerance range, it is shown as amber. If the value is below the tolerance limit, it is shown as red. Because of its high usability and effectiveness, it is also called the executive dashboard (Basu, 2004).
The financial part of the balanced scorecard shows the objectives Enterprise Rent a Car should have in order to appeal to its stakeholders. During the economic crisis, the car rental industry growth has been negative. From 2007-2012, the growth figures are -4.3% and -0.3% in the UK and the US, respectively. To strengthen its position in the market, Enterprise Rent a Car has expanded and increased its market share. The average growth from 2002-2011 has been 9% (averaged result across all companies of Enterprise Holdings with Rent a Car being the largest based on company sourced data). To reinforce the position, the company should keep investing and growing at the current rate. Another KPI to look at would be increasing profit per rental, lease and car sale. This is a key metric to look at how efficient the company is by keeping the costs down and therefore increasing its profitability. The key initiative to look at here is Lean Management, which would drive the efficiency of the company.
The customer perspective is of most importance to Enterprise Rent a Car, since it is their main method of being successful and creating profits. The two objectives therefore depict the critical metrics to see how well the company is doing, aiming for perfection in customer satisfaction ratings and good results in repeat business volume. The repeat business is capped at 90%, because it is nearly impossible for every customer to have the need to undertake business repeatedly with Enterprise Rent a Car.
The internal business process perspective has three objectives, which are mainly driven by efficiency and, therefore, follow Lean Management.
To be successful in the future, the Learning and Growth Perspective involves two key metrics, which are based on the idea that the company’s biggest assets for development are the people. Having perfect employee satisfaction is important in order to keep the resources from leaving, and continue contributing. Developing new leaders and managers from within the company is important, because it helps company endorse its vision through the people, who have believed in the business since they started working there. It also cuts expenditure, as there are lower recruitment costs and less chance of having compatibility issues.
Part 7 Recommendations
2.3 It is imperative that for a clear improvement to be derived from the use of models and theories, the models being applied must be applicable to the customer service process. Through the use of questionnaires and a pareto analysis we have been able to identify issues and directly link them to a flow diagram and critical to quality tree which have helped reinforce the thinking process behind areas failing to exceed the expectations of customer service.
Moreover through the DMAIC framework, in particularly the control stage, we have established the importance of applying the balance scorecard and PDCA model. The PDCA being recognised as a tool for continuous improvement and the way in which it should be deployed efficiently.
By drawing on some key aspects of the Toyota production system, Enterprise can seek new ways of ensuring efficient total quality management exists continuously. In order to maximise customer satisfaction, enterprise rent a car could consider:
The lack of customer feedback option
- To firstly address the impact of the lack of customer feedback option we believe Enterprise needs to implement an accessible and instant source of feedback during the check in process of the reservation. When closing each reservation via the software currently used, to introduce a final question before closing the reservation, ‘whether the customer was fully satisfied with there experience with Enterprise Rent-a-car and is there anything that could have been improved?” This therefore replaces the current outdated method of the SFL(Securities, Failure Log) log which through observation is hardly used by employees. Having a feedback option accessible before the customer leaves branch which is prompted by the software in place, means employees wouldn’t forget to ask the question and documentation wouldn’t be lost. This can therefore work as a more detailed accompany to the current ESQi survey. But the feedback option on the reservation is more representative as it asks every customer and is sampled on a daily rather than monthly basis.
Hidden charges
-
To address the second most likely cause of customer dissatisfaction of hidden charges. Enterprise needs to aim more focus on its employees. Currently, it is clear from our quantitative research that employees aren’t making the costing process clear to the customer. Therefore from a customer perspective there is therefore a lack of transparency behind additional costs involved in renting a vehicle. Here executing a training programme for new and current employees will refresh employees knowledge of the customer service process and allow new employees to follow best practices of current employees examples. The cost of this programme is discussed in the Justification Stage point 2.4.
Hiring of more front line service employees
-
Furthermore as discussed in the analysis stage point 1.10 we suggest the hiring of more front line staff which will take the pressure off current employees and allow quicker more accurate customer service. Currently, there is pressure from management to offer outstanding customer service, alongside generating more revenue from a sale by upgrading customers and selling ad on products. With the suggestion of introducing one-two more employees in certain branches that are experiencing lower ESQi scores and experience more retail business, the pressure to achieve on every level can be justified when shared amongst more employees. Of course Enterprise would need to assess each and every branch across each region to narrow down which branches are struggling to achieve the ESQi 82% customer satisfaction target. This therefore means a better distribution of staff amongst branches, of which the costs are discussed in the Justification Stage point 2.4.
Additional employee training
- Alongside employee training, Enterprise’s employees need to undertake an entire organisational culture change. Training programmes needs to be supported by a new attitude adopted by management firstly and then employees. Firstly, encouraging participation amongst employees can prove to be a key tool in fulfilling customer’s satisfaction. Through the kaizen approach this can be met, by incorporating a similar model to that of Toyota who considers their employees as members, as opposed to just an employee.
Employee leadership programmes
- Allowing employees to review their own job roles through monthly auditing checks, can ensure workers seek to continuously improve their own job role and consequently leading to less defects overall as a company.
- Secondly, Quality Circles provide workers with the chance to make suggestions and propose new ideas in groups (Mondon, pg 13), thus leading to improvements in quantity control and changes in cycle time.
- Similarly to Toyota enterprise should create jobs sheets that instruct employees on what they should do at each step during the check in process. This should be recited to a team leader/supervisor once a month of the top of their head. In doing this it will ensure a repetitive procedure is followed allowing for fewer mistakes to be made.
- Measuring how happy employees are on a daily basis through a performance chart, posting a positive or disappointed face on the chart, alongside a comment as to where they can improve the following week, can address the learning and development perspective of the balanced score card. By allowing employees to be creative and look for their own solutions, can help save the company time and money, whilst boosting morale. This can prove crucial to reduce defects across the board not just in relation to consumers.
The cultural change undertaken by employees must firstly begin with management. Through a top to bottom approach management must accept these issues and relevant improvements for ideas to be able to filter downwards. Enterprise rent a car employees are trained to appreciate the 8 core values imposed upon them by enterprise, by showing similar dedication to they’re workers in relation to expectations amongst members of staff, enterprise can amend their own issues, by making use of its own internal knowledge and know how. To implement change we believe it is important to hire an external manager to lead change across each region, of which the cost is discussed in the Justification Stage point 2.4. An external manager will be more effective than internal management, who may have biased opinions towards current processes and present a case towards resistance. Employees may also react more positively to an external perspective who is impartial.
Conclusively, the DMAIC framework provides a window of opportunity for enterprise rent a car to reflect upon their current ethos as a company. Through the analytical tools provided, the car rental industry could be revolutionised. This would result in the number of defects and customer complaints being reduced drastically, therefore providing a benchmark for performance measurement to be incorporated and an aim to achieve a six sigma quality standard.
7.2 Justifications
The implementation of the suggested project involves some minor financial investments. With the suggestion of hiring more front-line staff, each new employee will cost the company £15,000 per year. With a Enterprise Holding’s revenue of £8.747 billion ($14.1 billion with the rate of currency on the 23/4/2012) and approximately 70,000 employees worldwide, executing a training program for new and current employees will involve an opportunity cost of £2,130, which is quite insignificant, compared to the £125,000 revenue per employee generated yearly by the company.
To implement change and promote a manager to lead change, the rest of the project is estimated to cost £65,000 per region. It is proposed that this manager will continue to become a regional business development director after the execution of the project, applying knowledge and gained experience to further innovation and solutions in improving the company.
By rigorously putting into action the employee training and leadership programs, costs can be heavily cut by reducing staff turnover and, hence, decreasing hiring and training expenditure. Employee motivation will be improved, even further making an impact to the aforementioned factors. Moreover, they will induce providing better service and, therefore, higher customer satisfaction, giving way for company growth and an increase in profitability.
The improvement process is continuous, but the estimated time to undertake the project will be one year, during which a positive shift in employee attitudes and employee satisfaction and motivation should have taken place, resulting in higher customer satisfaction ratings by the end of the period. Since this would contribute also to Repeat Business Ratio and company’s public image, the financial returns and business growth would exceed the costs and effort required to undertake the process.
We propose Enterprise Rent-a-Car undertake the implementation of this project to gain higher customer satisfaction, repeat business and the financial returns associated to these factors.
Bibliography
Journals
Orr, M, L., Bush, D, V., Vorhies, W.D., 2009 Leveraging firm level marketing capabilities with marketing employee development. Journal of Business Research [e journal] 64 (10) p. 1074-1081
Date Accessed (11 March 2012)
Wayne, M., Wheeler, D., 2006. Making the case for the added-value chain. Strategy & Leadership [e journal] 34 (4) p.39-46
Date Accessed (11 March 2012)
Daniel, P., McDermott, P., Goh, M., 2008. Impact of value chain activities on quality and innovation. International Journal of Operations and Production Management [e journal] 28 (7) p. 615-635
Websites
The Quality Web, unknown. Step 1-Define. [online]
Available at: , [Accessed 10 February 2012]
Mind Tools, 2012. Affinity Diagrams Organizing ideas into common themes. [online] Available at: <>, [Accessed 11 March 2012]
Pareto Chart, unkown. [online]
Available: , [Accessed 27 March 2012]
Books
Toyota production system, Yasuhiro Monden, Second edition, 1993, printed in United States of America
Basu, R. (2004). Implementing Quality: A Practical Guide to Tools and Techniques. London: Thomson Learning.
Evans, J.R. (2005). Total Quality: Management, Organization and Strategy (4th ed). Mason, Ohio: Thomson/South-Western.
Evans, J.R. and Lindsay, W.M. (2011). The Management and Control of Quality (8th ed). Andover: South-Western Cengage Learning.
The Deming Dimension, Henry R.Neave , 1993, SPC press Inc