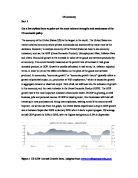
Current Account is the sum of the balance of trade (exports minus imports of goods and services), net factor income (such as interest and dividends) and net transfer payments (such as foreign aid). The balance of trade is typically the most important part of the current account. A positive current account (surplus) shows that the country has a good net international asset position while a negative current account (deficit) shows that the country has a bad net international asset position. In December 2010, the United States reported a current account deficit equivalent to 113 billion USD in the fourth quarter of 2010. This is because Malaysia has most of its income from international trade.
Figure 6 US Current Account. Adopted from
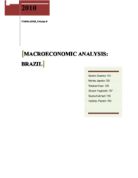
The main part of the current account it the Balance of Trade. The Balance of Trade shows the country’s imports (domestic demands) and exports (international demands). The United States reported a trade deficit equivalent to 45.76 Billion USD in February of 2011.
Figure 7 US Balance of Trade. Adopted from
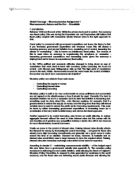
As mentioned earlier, one part of the Balance of Trades is the export. United States exports were worth 165.1 Billion USD in February of 2011. Main exports are: machinery and equipment, industrial supplies, non-auto consumer goods, motor vehicles and parts, aircraft and parts, food, feed and beverages. Main export partners are: Canada, European Union, Mexico, China and Japan
Figure 8 US Exports. Adopted from
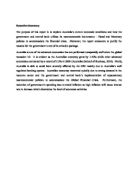
Another part of the Balance of Trade is the import. United States imports were worth 210.9 Billion USD in February of 2011, with its main imports are: non-auto consumer goods, fuels, production machinery and equipment, non-fuel industrial supplies, motor vehicles and parts, food, feed and beverages. Main import partners are: European Union, China, Canada, Mexico and Japan. This page includes: United States Imports chart, historical data and news.
Figure 9 US Imports. Adopted from
Part II
2) In 2005, the Bush administration pressed for additional tax breaks for top earners. Discuss the pros and cons of such tax exemptions towards the economy of the US. Did such policy cause the stagflation in the US. Support your answer with relevant macroeconomic theories.
Generally, during “Bush-era” there were only two main acts that lowered tax rates:
- The Economic Growth and Tax Relief Reconciliation Act of 2001;
- The Jobs and Growth Tax Relief Reconciliation Act of 2003.
The 2001 tax cuts, EGTRRA, included phased-in reductions to all marginal income tax rates, the estate and gift tax, the so-called “marriage penalty,” and increases in the child tax credit. The 2003 tax cuts, JGTRRA, accelerated many provisions of EGTRRA, temporarily increased favourable tax treatment of business investment, and introduced new provisions, including reductions in tax rates on capital gains and dividends. Major provisions of both acts were fully phased in by 2003, with the exception of reductions in the estate and gift tax. All of these acts and subsequent legislation provided temporary adjustments to the alternative minimum tax (AMT) to prevent an expansion in the number of taxpayers subject to it due to inflation and income growth. (Labont, 2010)
The tax cuts were financed through an increase in the budget deficit, meaning that the legislation enacting them contained no significant provisions to offset the revenue loss by raising other revenues or reducing spending. Likewise, if the tax cuts were allowed to expire as scheduled and no other actions were taken, the increase in revenue would reduce the budget deficit. (Labont, 2010)
Tax changes will always benefit one group of people over another. In this case there was a lot of talk over whether or not the new act would actually spur growth in the economy. Those opposed to the taxes argued that giving wealthy individuals tax breaks would do nothing to help the economy, and that the people who needed the help the most were left out of the act all together. Those who supported it argued that allowing tax cuts to the wealthy would help to send more money in to the economy and those who were earning little paid very little in taxes anyhow. (Financial Web, n.d.)
Depending on your situation this act may or may not have affected you. For the most part, most people have benefited from this act. Whether or not it actually helped with growth in our economy remains to be seen.
The tax cuts that occurred during George W. Bush’s terms in the White House were intended to stimulate economic growth through what is known as ‘supply side economics’. Increases in taxes reduce the economic output or supply of economic incentive and the result is smaller tax receipts than had taxes been reduced.
Bush era tax cuts subscribed to the belief a free market with lower tax had within itself the capacity to generate national wealth. Following the Economic Growth and Tax Reconciliation Act of 2001 and the Jobs Growth and Tax Relief Reconciliation Act of 2003, federal tax receipts did not rise substantially until 2005 when tax receipts increased from $1.388 trillion to $2.153 trillion according to the Urban Institute’s and Brookings Institution . Since 1944, federal tax receipts have ranged between 14-21 percent of GDP, the same range held during the Bush era also according to the tax center. (Berry, 2011)
Several types of tax cuts were instituted during the terms of President George Bush. The 2001 tax law lowered individual income tax across all income levels, in addition to gradually reducing estate taxes and increasing the child tax credit. The 2003 tax legislation aimed successfully reduced dividend taxes by 20 percent and the top income level of capital gains tax by 5 percent.
Although several Bush era tax cuts were sought to be permanent, expiration dates on the provisions were set to occur between 2008-2010. However, when President Barak Obama signed the Tax Relief, Unemployment Insurance Reauthorization, and Job Creation Act of 2010, the Bush era tax cuts were given new life and extended. For example, the Accounting firm report that the child tax credit, long-term capital gains tax, dividend tax rates and income tax had all been extended by two years.
Tax policy is a hotly debated issue, and the Bush era tax cuts are no exception. Analysts from both sides of the political spectrum have substantiated and arrived at conclusions supporting different levels of taxation. To illustrate, the determined the U.S. deficit as a percent of Gross Domestic Product (GDP) would have been 2.6 percent smaller had the Bush tax cuts not been implemented. Yet, to the contrary, in 2007 the Heritage Foundation, claimed the Bush tax cuts did not substantially reduce tax revenues, led to a larger tax burden on the rich and an increased economic growth by more than 100 percent or double that of 2003. (Berry, 2011)
The pros and cons of such tax exemptions:
The Pros
The US tax code is progressive, and arguably the Bush tax cuts increased the relative burden on the rich. In 2004, the top 20 percent of households paid a larger share of all US income taxes than they did in 2000, before President Bush took office.
Where fans of low-income tax cuts emphasize the benefits of added consumer spending, proponents of tax cuts for the rich say the move boosts savings and investment – and thus helps the economy.
Also, although the rich spend a bit less of each tax dollar saved, their role in consumer spending is very important. Finally, conservatives emphasize that raising tax rates can backfire, pushing capital out of the country or causing the wealthy to seek tax-shelters. (Trumbull, 2010)
The cons
Where conservatives argue that the Bush tax cuts helped make a weak economy stronger after 2001, liberal economists say they see scant evidence of this. And now, with gargantuan budget deficits, they say the responsible thing is to ask America's "haves" to pay at the tax rates they did in the late 1990s.
Just because the US tax code is progressive doesn't mean it's as progressive as it should be, these critics add. America's wide gap between the rich and the middle class or poor has widened considerably in recent years. Extending the Bush tax cuts would be worth about $340,000 in 2011 to the average household that ranks in the the top 0.1 percent by income.
The trend of widening inequality appears to be driven less by tax rates than by economic forces, such as wages that rise fastest for the skilled and educated. But some economists worry that American society and democracy will become less stable if this trend continues.
Whichever side is right, ending tax cuts for the rich will not close the federal budget gap by itself. Yes, it's big money. The tax breaks are estimated at $700 billion over the next decade. (Trumbull, 2010)
In economics, stagflation is a situation in which the inflation rate is high and the economic growth rate is low. It raises a dilemma for economic policy since actions designed to lower inflation may worsen economic stagnation and vice versa.
The concept is notable partly because, in postwar macroeconomic theory, inflation and recession were regarded as mutually exclusive, and also because stagflation has generally proven to be difficult and, in human terms as well as budget deficits, very costly to eradicate once it starts.
Economists offer two principal explanations for why stagflation occurs. First, stagflation can result when the productive capacity of an economy is reduced by an unfavorable supply shock, such as an increase in the price of oil for an oil importing country. Such an unfavorable supply shock tends to raise prices at the same time that it slows the economy by making production more costly and less profitable.
Second, both stagnation and inflation can result from inappropriate macroeconomic policies. For example, central banks can cause inflation by permitting excessive growth of the money supply, and the government can cause stagnation by excessive regulation of goods markets and labor markets. Either of these factors can cause stagflation.
Part III
3) Explain whether the Bush administration could or should have followed a different (macroeconomic) policy mix prior to the economic recovery. If so, what would have been the objective in terms of the real exchange rate or in terms of internal and external equilibrium? Or should the fiscal and monetary policy mix have been different in the early 2000s?
Generally, in macroeconomics, there are two policies which can help to achieve economic growth, price stability and employment rate. It is Fiscal and Monetary Policies.
In Fiscal Policy, the main factors are government expenditures and taxes. Basically, government collects taxes from people and spend this money “government expenditure” for many reasons, such as’ building roads, building new schools, hospitals and other. It is clear, that when government collects more taxes than the rate of government expenditure, it will lead to budget surplus. Governments will face budget deficit when its expenditures are more than the collection of taxes.
On the other hand, Monetary Policy is all about controlling the money supply in the market which can be done through the control of interest rate.
- Expansionary fiscal policy can happen when the government decides to increase in its expenditure AND/OR when there is a decrease in taxes.
- Contractionary fiscal policy happens when the government decides to reduce its expenditure AND/OR increase taxes. (Wiley Publishing, 2010)
There are three different ways in Monetary Policies: the “Discount Windows”, Open Market Operations and Reserve Requirement.
While, there are only two ways in Fiscal Policies: expansionary fiscal policy and contractionary fiscal policy.
- Open Market Operations can be conducted via open market sales (the buying of securities/bonds to increase money supply thus reduce interest rates) or open market purchase (the selling of securities/bonds to reduce money supply thus increasing interest rates).
- Reserve Requirement is set by the central bank. This is a percent of deposits that banks receive which will be set as a reserve in the central bank.
- The “Discount Windows” is a loan offered to banks at a rate which is usually lower than the market rate. This allows banks to get funds at a lower rate and thus affect the interest rates. (Financial Pipeline, n.d.)
Part IV
4) With the current stagflation in the US and the slowing of the economic growth of the economy in the US, suggest ways how could the Obama administration tackle these two issues. Use relevant macroeconomic theories with support of data and articles in your explanation.
What is stagflation? Generally, stagflation came from the words stagnation and inflation. Stagflation is a situation in which the inflation rate is high and the economic growth rate is low. How to solve this problem to Mr. B. Obama? The Misery Index is a good proxy measurement for the degree of stagflation. The misery index is calculated by adding the with the inflation rate. Another more useful way is probably to calculate Misery Index as a product of the unemployment and inflation rate. Generally, it is difficult to solve stagflation. The tricky thing about stagflation is that there is no easy way out of it once the economy is already experiencing it.
If the government decides to stimulate the economy by increasing spending and funding it with a loose (just a nice way of saying they will print money non-stop) then the inflation will become much worse.
Stagflation has two parts: first is the stagnation when the growth is slow and unemployment is rising; and second is the inflation. I believe that the US cannot use standard conventional economic policies to stop stagflation because this time round, stagflation happens for a different reason.
Let’s first address inflation part. The wars are becoming costly. They drain money, and fighting terrorism with terror ignites more terrors. The fear factor is shooting through the roof, and thus the oil price rises with it. It is a chain effect that when the oil price goes up, the delivery cost, groceries, etc. follow. Therefore, the cost of living simply goes up. Note that it is a globalization type of economy these days; for example, China makes clothing for the rest of the world, and if China has a power failure, the rest of the world will have low clothing supply, and with given demand and low supply, price adjust itself higher. This fearful effect happens to the world, and so the rest of the world feels this effect upward price adjustment. Therefore, inflation exists.
Stagnation is due to the rising cost of labour when the cost of living rises due to oil scare, and the lower end type of manufacturing become unsuitable to be produced in places where labour cost is high. Therefore, these jobs are outsourced to area of the world where labour is significantly cheaper. For example, China becomes the world factories, and India becomes the global call centres. This is actually making economic sense for the consumers because no one wants to pay higher price for the same product. So we can see outsource reduce the jobs, and when no new jobs are created to offset the scenario, unemployment grows. As people become unemployed, they have less to spend, thus less spending to stimulate the economy. The economical growth slows down because all these reasons. For example, the family buy clothes for the 3 sons in an economical efficient manner: the eldest son pass his clothes to the second son, and the second son passes his to the third son, and so only the eldest son need to buy clothes. Same here, if the US loses its manufacturing to other countries down the chain, it needs to invent new technologies, and move up higher in the food chain. The US has spent too much money in wars and defence research; the US should channel more funding to the other areas for economic growth. The US used to be known for its invention of cars, telephone, transistor and others. These seem to be yesteryear glory, as a result; the US needs to put in more efforts to keep this tradition of invention.
So now, when we see a better picture of the root cause of the stagflation problem that the US is in, the US can deal with it with an intelligent mind. Most importantly, make sure not to start another one (Iran war). Promote new technology so that US stay ahead of others and produce high tech product that everyone needs. Japanese Lexus make top rate cars where many people in the world buy. Canada RIM makes very secure communication product Blackberry that many people in the world buy. US should do the same.
REFERENCES
Berry A.W. (2011); “Bush-era tax cuts explained”, online. Accessed on 17th April 2011, Available from:
Financial Pipeline, n.d., “Monetary Policy”, online, date accessed: 17th April 2011. Available from:
Financial Web, (n.d.), “The Tax Relief Reconciliation Act: Pros And Cons”, The Independent Financial Portal, online. Accessed on 17th April 2011, Available from:
Labont M. (2010); “What Effects Would the Expiration of the 2001 and 2003 Tax Cuts Have on the Economy?” online, Congressional Research Service. Accessed on 17th April 2011, Available from:
Trumbull M., (2010) “Bush tax cuts 101: Do tax cuts for the rich help the economy?”, The Christian Science Monitor. online. Accessed on 17th April 2011, Available from:
Wiley Publishing, 2010, “Fiscal Policy”, online, date accessed: 17th April 2011. Available from:
Graphs:
Trading Economics, (2011); “US GDP Annual Growth Rate”, online, date accessed: 17th April 2011. Available from:
Trading Economics, (2011); “US GDP Percent Change at Constant Price”, online, date accessed: 17th April 2011. Available from:
Trading Economics, (2011); “US Inflation Rate”, online, date accessed: 17th April 2011. Available from:
Trading Economics, (2011); “US Unemployment Rate”, online, date accessed: 17th April 2011. Available from:
Trading Economics, (2011); “US Current Account”, online, date accessed: 17th April 2011. Available from:
Trading Economics, (2011); “US Balance of Trade”, online, date accessed: 17th April 2011. Available from:
Trading Economics, (2011); “US Exports”, online, date accessed: 17th April 2011. Available from:
Trading Economics, (2011); “US Imports”, online, date accessed: 17th April 2011. Available from:
INTI University College (2011)