Company
Australia and New Zealand Bank (ANZ) is the fourth largest bank in Australia, with a long history of 170 years. It is also one of the ten largest and most successful companies in Australia, with assets of AUD$476.99 billion. Its operation spans 32 countries across many continents, with a massive number of almost 400,000 shareholders.
ANZ’s performance and reputation has received much attention and accolades with it being named the most sustainable bank globally in the 2008 Dow Jones Sustainability Index, the 2nd year in a row ANZ has been granted the title. In 2007, the title was shared with another Australian bank, Westpac, which had held the title for the previous five years
With such global recognition, ANZ has been expanding and moving up its ladder. It has been expanding its operation aggressively in the Asia-Pacific region and is also the leading bank in New Zealand. In July 2006, ANZ acquired a 20 percent share in Tianjin City Commercial Bank and Shanghai Rural Commercial Bank respectively. One of the most recent and considerable milestone of ANZ would be its purchase of portions of the Royal Bank of Scotland in year 2009, spanning across geographically in Taiwan, Singapore, Indonesia, Hong Kong, Philippines and Vietnam.
With such performance and increasing market power and global presence, ANZ is currently one of the best performing stocks in the financial sector of the ASX. It is ranked 3rd in the competitive 295 companies sector, with a contribution of AUD$54, 754 million. The financial sector has been going through a 12% growth for the past year, with ANZ one of its largest contributors. (http://www.anz.com)
(Source: Australian Securities Exchange)
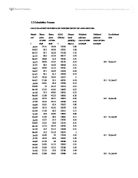
Stock’s Intrinsic Value (ANZ)
The above chart is determined by using the Free Cash Flow Discount Dividend model, using the Company’s Average Free Cash Flows from investments from year 2000 to 2009 to calculate the Intrinsic Value.
Intrinsic value per share is calculated based on Free Cash Flow value with calculated growth based on ROE and b. The Intrinsic Value is divided by the total number of shares currently in the market to attain the Intrinsic Value per share.
Growth rate is calculated to be at 6%pa based on the payout ratio and retention ratio. Due to the ANZ’s recent acquisition of Royal Bank of Scotland and it being in its maturity stage, we estimate the growth rate of the company to be gradually increasing from the current 6% to 20% in the next 5 years.
Conclusion
Based on the fundamental analysis, ANZ stock price is in a good position to move up. Therefore, Johnnie should buy the stock.
Technical Analysis
Introduction
Technical analysis is an entire different approach from fundamental analysis. To put it simply, technical analysis is only interested in the price movements in the market and this is often done through the use of charts. Technical analysis attempts to study supply and demand of the market to determine the direction and trend that may happen in the future.
The field of technical analysis is based on three assumptions.
(1) The market discounts everything
Technical analysis assumes that a stock price reflects everything that has and could affect the company and hence, fundamental factors are reflected without the need to be considered separately. Hence, the analysis of price movement through technical analysis should be done as it is vital and representative of the stock as a whole.
(2) Price moves in trends
In technical analysis, price movements are believed to follow trends. This means that after a trend has been established, the future price movement is more likely to be in the same direction as the trend than to be against it.
(3) History tends to repeat itself.
The repetitive nature of price movements has been observed and has been attributed to market psychology. Market participants have been found largely to provide a consistent reaction to similar market stimuli over time. With such repetitive reactions, chart patterns are concrete in analyzing market movements for the understanding of trends as history tends to repeat itself.
Just as many tools are available for fundamental analysis, a range of indicators are available for technical analysis. This report uses the Moving Average Convergence Divergence (MACD), Relative Strength Index (RSI) and Support and Resistance levels to aid in the better understanding of the price trends of ANZ.
Moving Average Convergence Divergence (MACD)
The MACD is one of the most well-known and used indicators in technical analysis. It comprises of two exponential moving averages which help to measure momentum in the security. The MACD measures short-term momentum compared to longer term momentum, allowing for signals with regards to the current direction of momentum. When the MACD is positive, it signals that the shorter term moving average is above the longer term moving average and suggests an upward momentum. When the MACD is negative, it signals the opposite.
Using the commonly used 12 short periods, 26 long periods and 9 EMA periods, MACD is charted for ANZ. (Based on 5 years history)
One of the most common buy signals are generated when the MACD crosses the signal line, as shown at the upward cross in the figure while sell signals often occur when the MACD crosses below the signal, as shown at the downward cross in the above figure. Based on the chart’s purple circles, the MACD and signal line have been observed to be on par with each other for most periods of time. The latest MACD and signal line are once again on par with each other, Johnnie can buy the stock as based on past trends as it is hardly that the MACD goes below the signal line.
Relative Strength Index (RSI)
The RSI is another well-known and used tool in technical analysis. It helps to signal overbought and oversold conditions in a security. Plotted in a range of 0 to 100, a reading above 70 is used to suggest that a security is overbought while a reading below 30 is used to suggest that it is oversold. This indicator helps traders to identify whether a security’s price has been unreasonably pushed to current levels and whether a reversal may be on the way.
A RSI is charted for ANZ based on its 5 years history, suggesting the periods over the 70 reading to have been overbought and those under 30 to have been oversold.
Based on the chart above, the latest showings by ANZ signalled by the purple circle are within the boundaries, signalling that it is not overbought or oversold. As such, it is a good time for Johnnie to buy the stocks since they are not unreasonably priced.
Support and Resistance
A security price seldom moves above its resistance or below its support level. Support and resistance levels are important in terms of market supply and demand as traders are willing to buy the stock at support level and sell it at resistance level. Once these trends are broken, it is thought that supply and demand have shifted and a new support and resistance level will likely to be established.
Based on the last third quarters of 2009 and first three quarters of 2010 history of ANZ, its support and resistance level is established at resistance level approximately AUD$24.50 and support level approximately AUD$21.
Based on the latest showings of ANZ (purple circle), the stock price is predicted to rise at least till its resistance level. As such, Johnnie should buy the stock now as there are rooms before the stock price hits resistance. Besides, the last time the stock price hit resistance level (black circle), it moved slightly above resistance. Based on ANZ’s current showings, there is a high possibility for price to move up another resistance level.
Price Predictions
The above chart resembles a breakout from the price convergence pattern of the upside over the medium term (3-6months) and suggests a rising trend with a short term target of 2/3rds the depth of the price convergence pattern. This is roughly $24 + (2/3 x (25.80-21)) or $27.20.
This prediction of a rise in price can be further justified with by the current stock market which is on its way to recovery after going down from the period of April to July 2010. As the stock market recovers, ANZ stock will be positively affected as well.
(Source: http://www.tradingeconomics.com/default.aspx)
Australia’s economy on the whole has also been doing well since the start of 2010. The major indicator of the macro-environment, Australia’s GDP Growth Rate has been buoyant with a significant positive increase in the third quarters of 2010. With the economy performing well as a whole, the price prediction of ANZ rising can be further justified.
(Source: http://www.tradingeconomics.com/default.aspx)
Conclusion
Based on the technical analysis, the trends and price predictions show that ANZ stock price is once again in a good position to move up. Therefore, Johnnie should buy the stock.
Why Invest?
Competitors
Based on the above chart, the ten years history of the stocks show that ANZ been the one of the best performing stocks compared to its closest competitors. ANZ achieved a +73.35%, with CBA closely behind at +71.26% and NAB performing badly at -4.08%. Although ANZ and CBA are performing well and almost on par, ANZ’s latest acquisition of RBS and its aggressive expansions and vision for the future put it in good position to outperform its competitors.
Future Prospects
ANZ has bright future prospects with its expansions into Asia and an overall well-doing in all regions.
(Source: The Courier-Mail)
ANZ’s latest announcements include a windfall net profit of ANZ$4.5billion last year, up 53% and an ambitious expansion plan to push deeper into Asia in its next phase. Chief Mike Smith said that Australia's economy was ''entirely linked to the wellbeing and future economic growth'' of Asia and a bigger presence in Asian markets would give the bank a better geographical mix”. With a total of 55% of revenue coming from Asia, ANZ is setting a target to further gain from the area. With ANZ doing well, shown from statistics of cash earnings up 51.7% to ANZ$51.3billion, revenue up 15% to ANZ$15.7billion, basic EPS up 37% to ANZ178.9cents and final dividend up 32% to ANZ74cents, prospects of the company is bright and confidence buoyant. (http://www.couriermail.com.au)
Recommendation
Based on the both financial and technical analysis, Johnnie should buy ANZ stocks.
Reference
-
Australian Trade Commission. “Strong and Sophisticated Financial Services Sector”. http://www.austrade.gov.au (accessed October 12th, 2010.)
-
Australian Government Department of Foreign Affairs and Trade. “Australia in Brief”. http://www.dfat.gov.au (accessed October 14th, 2010)
-
Australia and New Zealand Bank. “Investor Center”.www.anz.com (accessed October 5th, 2010)
-
Australian Securities Exchange “ASX”. http://www.asx.com.au/ (accessed October 18th, 2010)
-
Courier Mail. “ANZ pins all its hopes on Asian future”. http://www.couriermail.com.au/ (assessed November 1st, 2010)
-
Trading Economics. “Indicators for Australia”. http://www.tradingeconomics.com/default.aspx (accessed October 10th, 2010)
- http://203.15.147.66/research/pdf/financial_sector_factsheet.pdf
Fundamental and Technical Analysis 2 (SingTel)
Singapore
Overall Economy
Singapore's strategic location on major sea lanes and its industrious population have given the country an economic importance in Southeast Asia. Singapore's economic strategy has been a success, producing real growth that averaged 7.8% from 1965 to 2009. The recent global financial crisis of 2008 and 2009 however, has dealt a blow to Singapore's open, trade-oriented economy. Singapore saw its worst two quarters of contraction in late 2008 and early 2009, but quickly recovered with strong performance in later quarters. The official growth forecast for 2010 is between 4.5% and 6.5%. Recovery is on its way as seen from the chart, based on the first two quarters of 2010. (www.singstat.gov.sg)
(Source:http://www.tradingeconomics.com/default.aspx)
Singapore’s inflation rate has also always been maintained at a mild level except for the period of 2008-2009. Towards the end of 2009, inflation rate has recovered to its mild level, signalling the excellent health of the economy.
(Source:http://www.tradingeconomics.com/default.aspx)
Industries
Singapore’s economy comprises of mainly two sectors, manufacturing and services. Manufacturing (including construction) and services are the twin engines of Singapore’s economy and account for 26% and 69.3% respectively of Singapore's Gross Domestic Product (GDP) in 2009. The government has also opened the financial services, telecommunications, power generation and retailing sectors to foreign service-providers for greater competition. (www.business.gov.sg)
In 2009, Singapore's imports and exports totalled to $245 billion and $269 billion respectively. Re-exporting of imports accounted for 48.9% of Singapore's total sales to other countries in 2009. Singapore continues to attract investment funds on a large scale despite its relatively high-cost operating environment. (www.business.gov.sg)
As of December 2009, Singapore has a total labour force of about 2.99 million. Singapore has also enjoyed almost full employment for substantial periods of time. Overall, some of Singapore’s unemployment is attributable to structural changes in the economy due to low-skill manufacturing operations moving overseas. Since the early nineties, the number of foreign workers in Singapore has increased rapidly to cope with labour shortages. Foreign workers comprise 35% of the labour force. (www.business.gov.sg)
- Transportation and Communications
Singapore is a centre for transportation and communication in Southeast Asia. Singapore's Changi International Airport is a regional air travel hub served by 80 airlines. Telecommunications and internet facilities are high-tech, providing excellent communications with the rest of the world. Singapore is rolling out a nationwide broadband network that assures high-speed internet connections at competitive prices. 60% of the country is slated to be covered by the end of 2010. (www.business.gov.sg)
Stock Market
The Straits Times Index (STI) is a market value-weighted stock market index based on the stocks of 30 representative companies listed on the Singapore Exchange. With a 40-year history, the STI is the leading market barometer of the Singapore stock market. Its primary objective is to reflect the daily trading activity of stocks on the Singapore Exchange (SGX).
Launched in the wake of a major sectorial re-classification of listed companies by the Singapore Exchange, which saw the removal of the "industrials" category, the STI replaced the Straits Times Industrials Index (STII), and began trading 31 August 1998 at 885.26 points, in continuation of where the STII left off. Then, it represented 78% of the average daily traded value over a 12-month period and 61.2% of total market capitalization on the exchange.
Constructed by the Singapore Press Holdings, the Singapore Exchange and Professor Tse Yiu Kuen from the Singapore Management University, it comes under formal review at least once annually or whenever necessary. One review raised the number of stocks from 45 to 50, which took effect when trading resumed on 18 March 2005. This change reduced the index representation of the average daily traded value to 60%, while increasing its total market capitalization to 75%
Based on the statistics for the past three years, the Singapore Stock Market Index has been performing well, with the exception of year 2009 due to the global economic crisis. However, the stock market is going on the upwards trend once again with the new beginning of the year 2010.
(Source:http://www.tradingeconomics.com/default.aspx)
Telecommunications Industry
January 2000 marked a new chapter in the history of Singapore's telecommunication services sector when Singapore Government announced the full liberalization of the telecommunications industry. Realizing that the development of the local telecommunications services sector is dependent on being globally competitive, the Singapore Government also advanced the introduction of full market competition in the local telecommunications services sector by two years from 2002 to 2000.
Singapore’s telecommunications industry comprise of mainly three companies, namely Singapore Telecom Mobile Pte Ltd ("SingTel Mobile"), StarHub Mobile Pte Ltd ("StarHub Mobile") and MobileOne (Asia) Pte Ltd. Being an integral player in Singapore’s Info-Comms Technology sector, the telecommunications companies are contributing massively to the fastest growing sector in the industry. The Info-Comms Technology sector has been growing at an astonishing rate of 13%pa since 1986.
(Source: http://app.mti.gov.sg/data/pages/507/doc/ERC_SVS_Part1.pdf)
Besides telecommunications companies in the Info-Comms Technology sector, IT and software companies also constitute a bulk of it. With the liberalization and good performance in this sector, Singapore has also attracted many global investors in this area. They include NTT, AT&T, Reach and Belgacom. Competition from foreign companies serves as a good push to Singapore companies, with Singapore’s overall economy deriving 18% of their total revenue from this sector, higher than its global competitors such as Australia, Hong Kong, Taiwan and South Korea.
Company
SingTel has 130 years of operating experience in Singapore and has played an integral part in the development of the country as a major communications hub in the region. Today, SingTel continues to shape the digital media and ICT market in Singapore. It provides a diverse range of services to meet the communications needs of consumers and businesses, including mobile and fixed-line voice and data, narrow band and broadband Internet services. SingTel also is the massive provider of integrated Information Technology and communications solutions. (www.singtel.com)
Despite full liberalisation of the telecommunications sector since 2000, SingTel remains the leading mobile, broadband and fixed line operator. In July 2007, SingTel ventured into home entertainment with the launch of its Mio TV. In September 2010, SingTel also launched high-speed fibre services, with distinctive applications focusing on entertainment, convergence and productivity enhancement for home and business users. (www.singtel.com)
SingTel stocks have also been performing well for the past years and have been ranked among the top 20 value stock in the SGX. (Source: Singapore Exchange)
Stock’s Intrinsic Value (SingTel)
The above chart is determined by using the Free Cash Flow Discount Dividend model, using the Company’s Average Free Cash Flows from investments from year 2000 to 2009 to calculate the Intrinsic Value.
Intrinsic value per share is calculated based on Free Cash Flow value with calculated growth based on ROE and b. The Intrinsic Value is divided by the total number of shares currently in the market to attain the Intrinsic Value per share.
Growth rate is calculated to be at 6%pa based on the payout ratio and retention ratio. Due to SingTel patent rights to be the first telecommunication company to launch iPhone 4 and it being the leading telecommunications company for significant number of years, we estimate the growth rate of the company to be gradually increasing from the current 6% to 20% in the next 5 years.
Conclusion
Based on the fundamental analysis, SingTel stock price is in a good position to move up. Therefore, Johnnie should buy the stock.
Technical Analysis
Introduction
Technical analysis is an entire different approach from fundamental analysis. To put it simply, technical analysis is only interested in the price movements in the market and this is often done through the use of charts. Technical analysis attempts to study supply and demand of the market to determine the direction and trend that may happen in the future.
The field of technical analysis is based on three assumptions.
(1) The market discounts everything
Technical analysis assumes that a stock price reflects everything that has and could affect the company and hence, fundamental factors are reflected without the need to be considered separately. Hence, the analysis of price movement through technical analysis should be done as it is vital and representative of the stock as a whole.
(2) Price moves in trends
In technical analysis, price movements are believed to follow trends. This means that after a trend has been established, the future price movement is more likely to be in the same direction as the trend than to be against it.
(3) History tends to repeat itself.
The repetitive nature of price movements has been observed and has been attributed to market psychology. Market participants have been found largely to provide a consistent reaction to similar market stimuli over time. With such repetitive reactions, chart patterns are concrete in analyzing market movements for the understanding of trends as history tends to repeat itself.
Just as many tools are available for fundamental analysis, a range of indicators are available for technical analysis. This report uses the Moving Average Convergence Divergence (MACD), Relative Strength Index (RSI) and Support and Resistance levels to aid in the better understanding of the price trends of SingTel.
Moving Average Convergence Divergence (MACD)
The MACD is one of the most well-known and used indicators in technical analysis. It comprises of two exponential moving averages which help to measure momentum in the security. The MACD measures short-term momentum compared to longer term momentum, allowing for signals with regards to the current direction of momentum. When the MACD is positive, it signals that the shorter term moving average is above the longer term moving average and suggests an upward momentum. When the MACD is negative, it signals the opposite.
Using the commonly used 12 short periods, 26 long periods and 9 EMA periods, MACD is charted for SingTel. (Based on 5 years history)
One of the most common buy signals are generated when the MACD crosses the signal line, as shown at the upward cross in the figure while sell signals often occur when the MACD crosses below the signal, as shown at the downward cross in the above figure. Based on the chart’s purple circles, the MACD and signal line have been observed to be on par with each other for most periods of time. The latest MACD and signal line are once again on par with each other, Johnnie can buy the stock as based on past trends, as it is hardly that the MACD goes below the signal line.
Relative Strength Index (RSI)
The RSI is another well-known and used tool in technical analysis. It helps to signal overbought and oversold conditions in a security. Plotted in a range of 0 to 100, a reading above 70 is used to suggest that a security is overbought while a reading below 30 is used to suggest that it is oversold. This indicator helps traders to identify whether a security’s price has been unreasonably pushed to current levels and whether a reversal may be on the way.
A RSI is charted for SingTel based on its 5 years history, suggesting the periods over the 70 reading to have been overbought and those under 30 to have been oversold.
Based on the chart above, the latest showings by SingTel signalled by the purple circle are within the boundaries, signalling that it is not overbought or oversold. As such, it is a good time for Johnnie to buy the stocks since they are not unreasonably priced.
Support and Resistance
A security price seldom moves above its resistance or below its support level. Support and resistance levels are important in terms of market supply and demand as traders are willing to buy the stock at support level and sell it at resistance level. Once these trends are broken, it is thought that supply and demand have shifted a new support and resistance level will likely to be established.
Based on the last third quarters of 2009 and first three quarters of 2010 history of SingTel, its support and resistance level is established at resistance level approximately SGD$3.20 and support level at approximately SGD$2.94.
Based on the latest showings of SingTel (purple circle), the stock price is predicted to rise at least till its resistance level. As such, Johnnie should buy the stock now as there are rooms before the stock price hits resistance. Besides, the resistance level (black circle) has been broken just during the second quarters of 2009. Based on SingTel’s current showings, there is a high possibility for price to move up another resistance level.
Price Predictions
The above chart resembles a breakout from the price convergence pattern of the upside over the medium term (3-6months) would suggest a slightly rising trend with a short term target of 3/4 the depth of the price convergence pattern. This is roughly $3.10 + (3/4 x (3.15-2.70)) or $3.44.
This prediction of a rise in price can be further justified by the current stock market which is buoyant and recovering very well. This can be seen from the sharp increase in the Singapore Stock Market Index in the past few months, specifically the positive jump observed from August 2010 till date. As the stock market performs well, SingTel stock will be positively affected as well.
(Source:http://www.tradingeconomics.com/default.aspx)
Singapore’s economy on the whole has also been doing well since the start of 2010. The major indicator of the macro-environment, its GDP has been buoyant with a significant positive increase since the start of 2010. With the economy performing well as a whole, the price prediction of SingTel rising can be further justified.
(Source:http://www.tradingeconomics.com/default.aspx)
Conclusion
Based on the technical analysis, the trends and price predictions show that SingTel stock price is once again in a good position to move up. Therefore, Johnnie should buy the stock.
Why Invest?
Competitors
- SingTel vs. MobileOne (M1)
Based on charts above, the five years history of the stocks show that SingTel (Z74.SI) has been outperforming both its nearest competitors, M1 (B2F.SI) and Starhub (CC3.SI). Therefore, with history as its strongest backing and SingTel’s optimistic future visions, SingTel is in a very good position in continual outperformance compared to its competitors.
Future Prospects
SingTel’s total mobile customer base increased 4.7 per cent to 3.1 million as at 31 March 2010 and maintained its lead position with a market share of 45.2 per cent.
With a recent closed colossal deal with Telmap to create a navigation service, SingTel is venturing further and broader into all aspects of communications. Xplorer that will run on any GPS enabled mobile device will be made available on the SingTel network. Telmap is a big deal in the world of mobile navigation. It creates navigation and location search features for whoever is willing to pay for service. The application is touted to work on all GPS supporting handsets, including recently released Smartphone like the iPhone 4.
This is a very significant move from SingTel, especially as Xplorer is a much sought-after value-added service. Worthy of mention from this collaboration would be the service being made available to all SingTel subscribers for free. Such continuous efforts by SingTel to provide value added services and progress ahead of its competitors will see good future prospects for the company’s operations and in turn, its stock value. (www.singtel.com/)
Recommendation
Based on the both financial and technical analysis, Johnnie should buy SingTel stocks.
Reference
-
Enterprise One. “Market Statistics and Research”. http://www.business.gov.sg (accessed October 28th, 2010)
-
Singapore Exchange. “SGX”. http://www.sgx.com/ (accessed October 18th, 2010)
-
Statistics Singapore. “Latest Data”. http://www.singstat.gov.sg/ (accessed October 22nd, 2010)
-
SingTel. www.singtel.com/ (assessed October 4th, 2010)
-
Trading Economics. “Indicators for Singapore”. http://www.tradingeconomics.com/default.aspx (accessed October 10th, 2010)
- http://app.mti.gov.sg/data/pages/507/doc/ERC_SVS_Part1.pdf