2.2 GDP & CPI
The gross domestic product (GDP)is the amount of goods and services produced in a year, in a country. It is the market value of all final goods and services made within the borders of a country in a year.
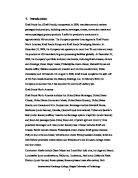
As mentioned above, after a serious decline in financial crises, the US economy begun to rise. Last year, the US gross domestic product (GDP) was 14,256 billion dollars. The growth rate is more than 2%.
Consumer Price Index refers to product price and people’s everyday consumer, and also relate to the inflation. The CPI is defined by the United States Bureau of Labor Statistics as "a measure of the average change over time in the prices paid by urban consumers for a market basket of consumer goods and services.The CPI of the United States is divided into eight main categories, such as residential, food, transport, medical, clothing, entertainment, education and so on.
This chart is about the GDP growth rate in the US from Jan, 2000 to Jan, 2010.
2.3 Interest Rate and Foreign Exchange Rate
An interest rate is the rate at which interest is paid by a borrower for the use of money that they borrow from a lender. Interest rates targets are also a vital tool of monetary policy and are taken into account when dealing with variables like investment, inflation, and unemployment.
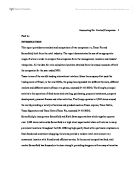
This chart is about the Interest Rate in the US from Jan, 2002 to Jan, 2010.
Form this chart, we can clearly see that the rate has a rapid growth between 2004 and 2007. The rate from 1% to 5.25% after Alan Greenspan 17 times increased the interest.
After financial crisis, the rate drop quickly. And now it is stand in a stable level in 0.25%. Such a low interest rate is for Stimulate economic growth.
In recent years, American‘s foreign exchange rate is continue decline. The current rate of the US dollar to RMB is only 6.63. That means one US dollar can only exchange 6.63 RMB. Several years ago, the number is 8.
It can stimulate the US export economy, it can provide and export low price products to other countries.
2.4 Fiscal and Monetary Policy
Most attention news about Federal Reserve recently is that they will implementation of the policy of quantitative easing. This is the second time Federal Reserve issue the Quantitative easing policy. Once before was issued in March 2009.
Quantitative easing is a monetary policy, it is mean that the Central Bank increase the money supply according open market operations. We can understand it in the US Central Bank have an increase in printing money.
In the November 2010, the Federal Reserve announced the launch of the second round of the quantitative easing program. The Central Bank will print 600 billion dollars in next 8 mouths. This policy is for stimulate the economy and prevent deflation.
3. Industry Analysis
Kraft Foods Inc. is the largest confectionery, food, and beverage corporation headquartered in the United States. And it is also the second largest food corporation in the international. It markets many brands in more than 155 countries. 11 of its brands annually earn more than $1 Billion worldwide: Kraft, Cadbury, Oscar mayer, Maxwell House, Nabisco, Oreo, Philadelphia Creme Cheese, Jacobs, Milka, LU and Trident.
The competition in the food industry is very heavily. In 2004, it sold its sugar confectionery division to Wrigley, its pet snacks division (Milk-Bone) in 2006, juice drinks and Fruit2o in 2007 and some grocery brands in 2006.
In July 2007, the company bought Groupe Danone's biscuit (cookie) and cereal division for $7.2 billion, including iconic French biscuit brand Lefèvre-Utile.
In November 2007, Kraft agreed to sell its cereal unit to Ralcorp Holdings, a major private-label food maker, for $2.6 billion in a form of a spin-off merger. This would add 50% to Ralcorp's sales, to $3.3 billion, and will be used for Kraft's debt payment, which is at $13.4 billion, in danger of a downgrade by Standard and Poor's.
On September 7, 2009, Kraft made a £10.2 billion takeover offer for the long-established British confectionery group Cadbury, makers of Dairy Milk and Bournville chocolate. On November 9, 2009 Kraft's £9.8bn takeover bid was rejected by Cadbury. Cadbury stated that the takeover bid was a "derisory" offer. Kraft renewed the offer under the same terms on December 4, 2009. The offer generated significant political and public opposition in the United Kingdom and abroad, even leading to calls for the government to invoke a policy of economic protectionism in cases of takeovers of large companies. On January 19, 2010, Cadbury finally approved a revised offer from Kraft, valuing the confectionery business at $19.5 billion. The funding for the takeover is partially provided by the Royal Bank of Scotland, the British state-owned bank.
On January 6, 2010, Kraft agreed to sell its North American frozen pizza business to Nestle for $3.7 billion.
Now, the most threatening is the Nestle Inc. It is also the biggest food company in the world, and the only one company ranking in the front of Kraft Foods.
The other major competitors are Unilever Inc., PepsiCo Incorporated, Mars Inc. and so on. They are very powerful food companies.
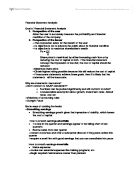
This table is the ranking of the most popular candy:
From this table, we can see Kraft Foods Inc. have three brands in this ranking. It means Kraft Foods have a big market share in the candy market. Similarly, the other goods are also popular in the world. Like the Oreo biscuit. It takes a new way for us to eat. Eat the Oreo with milk, everyone feels very delicious.
4. Company Analysis
4.1 Horizontal analyses
Analysis: The growth rate of revenue in 2009 has a serious drop compare with the number in 2008. In 2008, the number is 16.9%, and it dropped a number of 20.6% to -3.7% in 2009. Luckily, the percentage change in cost of revenue also has a decrease. The number decreased from 18.7% to -8.2%. It means, we got less and offer less. The percentage change of operating income is a good point between these two table. In 2009, the number is 43.7%, and it just -8.0% in 2008. Compare with the net income between 2009 and 2008, we find it have a decrease of nearly 1.2%. General, the ratios are good.
Analysis: From these two tables, we find Kraft Foods have a progress in 2009. The growth rate of total assets and total equity all have a great increase. The growth rate of total assets was -7.09% in 2008, and it was 5.61% in the 2009. The growth rate of total equity was -18.32% in 2008, and it increased by 34.38% to 16.06%. The total liabilities increased a little in 2008, and also dropped a little in 2009. It means total liabilities also have a little progressive.
4.2 Trend Percentages Analysis
Analysis: From the tables and chart, we can easily find that there only one item-Gross Profit was rose between 2006 and 2009. And the net sales was rose in the early three years, but it dropped in the latest year. Differently with the net sales, the net income was dropped in 2007, and it recovered in 2008 and 2009. The net sales drop but the net income rise is a good sign. It means Kraft have a good internal management within their companies .
Analysis: From these tables and chart, we find that total current liabilities are the most complex in these four items. It has a sharply rose in 2007, then it drop in 2008 and keep stable in 2009. The total assets rose smooth between 2006 and 2009. The total assets rose little in 2007, and it keep stable in the next years. The total liabilities are similar to the total assets. But the growth rate is bigger than total assets in 2007.
4.3 Vertical Analysis
Analysis: The percent of current assets in 2009 have a little increase compared with the percent in 2008. In 2009, the number is 18.67%, and it was 18.14% in 2008. The other good news was in the point of current liabilities. It has decrease a number of 0.26% from 17.48% to 17.22%. And the percent of total Debt and total liabilities are also has progresses. The percent of total Debt was 32.06% in 2008, and it was 28.46% in 2009. The percent of total liabilities was 64.71% in 2008, and it was 61.21% in 2009. These data means Kraft Food have a great progress in the management in assets and liabilities. The financial position in Kraft Foods is very good in 2009.
Analysis: From the table, we can find that the percent of cost of revenue have little decrease between 2008 and 2009. The number in 2008 was 66.98%, and it was 63.85% in 2009. Through the cost of revenue was decreased, but the gross profit have some increase. The number was 33.02% increased to 36.15% between 2008 and 2009.
The biggest difference between 2008 and 2009 was the unusual expense (income). It was 1,116.00 million dollars (2.66%) in 2008, and the number in 2009 was -58.00 million dollars (-0.14%). It is the major reason that the cost of revenue was decrease but net income increased.
4.4 Benchmarking
Analysis: Compare with the two charts, we can see that the percent of the cost of goods sold and operating expense in Kraft Foods are lower than the percent in industry. But the operating income is much higher than the industry level. The percent of operating income in Kraft Foods is 13.68 and it was only 7.61% in industry.
Analysis: Compared to the PepsiCo, we can see that Kraft Foods’ cost of goods sold is much higher. But the percent of operating expense is lower than the percent in PepsiCo. In the part of operating income, Kraft Foods was 13.68% in 2009, and the number of PepsiCo was 18.61%.
4.5 Analysis of the Statement of Cash Flows
Analysis: From these two tables, we can see that the operating cash in 2008 and 2009 are both the major source. The numbers are $4,141 million and $5,084 million. The net cash outflow from financing activities is $2,057 million and $3,133 million in 2008 and 2009. It means that investing activities include more purchasing than selling of long-term assets. All the signs show that Kraft Foods Inc.’s financial position remains strong, and it’s a healthy company.
4.6 Financial Ration Analysis
4.6.1 Liquidity Ratio:
- Working Capital = Current assets – current liabilities
= 12,454.00 - 11,491.00 = 963.00
Working Capital is the capital that company can use to run the daily operations.
From the Positive working capital, it means that Kraft Foods Inc. is able to pay off its short-term liabilities.
2. Current Ratio (CR) =
=12,454.00 / 11,491.00 = 1.08
Industry=1.53
Sector=1.04
In theory, the higher the “current ratio”, the better. Through calculation, we figure out that Kraft Foods’ current ratio is less than the industry and higher than sector.
- Quick Ratio (QR)
=
= (2,101.00 + 0 +5,197.00) / 11,491.00
= 0.64
Industry=1.05
Sector=0.74
Quick Ratio shows the ability of the company pay back the liabilities with cash or equivalents. Kraft Foods’ Quick Ratio is less than 1, which means it can’t pay back the current liabilities. And also it is smaller than the industry ratio and the sector ratio.
4.6.2 Assets Management Ratio
- Inventory turnover
=
= 25,786.00 / [(3,775.00 + 3,881.00) / 2]
= 6.74
Industry=4.06
Sector=5.91
Inventory turnover is a measure of the number of times the average level of inventory is sold during a year. The inventory turnover of Kraft Foods is 6.74, and it is larger than the industry ratio and sector ration.
- Accounts receivable turnover
=
= 40,386.00 / [(5,197.00 + 4,704.00) / 2]
=8.16
Industry=5.23
Sector=19.93
Accounts receivable turnover measures a company’s ability to collect cash from credit customers. The resulting ratio tells that 13.98 times during the year the average level of receivables is turned into cash.
- One day’s sale = = 40,386.00 / 365 = 110.65
Day’s sales in receivables =
= (5,197.00 + 4,704.00) / 2 / 110.65
= 45
Days’ sales in receivables ratio measures how many days’ sales remain in Accounts Receivable. This figure is the smaller the better. So, Kraft Foods didn't do good in this point.
- Net fixed assets = Fixed assets – Depreciation
= 66,714.00 - 12,454.00 - 8,730.00 = 45,530.00
Fixed assets turnover =
= 40,386.00 / 45,530.00 = 0.89
Fixed assets turnover indicates the proportion of net fixed assets with sales. The figure is the larger the better.
- Total assets turnover =
= 40,386.00 / 66,714.00 = 0.61
Industry=0.68
Sector=0.65
Total assets turnover shows the proportion of total assets with sales. The larger the
figure is, the faster the company receives money. Kraft Foods’ ratio is smaller than the industry ratio and sector, which means Kraft Foods is not efficiency at using its assets in generating revenue.
4.6.3 Debt Management Ratio
- Debt ratio =
= 40,838.00 / 66,714.00 = 0.61
The debt ratio indicates the proportion of assets financed with debt. Robert Morris Associates reports that the average debt ratio for most companies ranges around 0.57-0.67, and the ratio of Kraft Foods (0.61) is in this range. So, the Kraft Foods is very good in this point.
- Times-interest-earned (TIE) ratio / Interest coverage
= Income from operations / Interest expense
=4,287.00/23.00
=186.4
Times-interest-earned (TIE) ratio is the higher the better. So, it is good sign for Kraft Foods.
4.6.4 Profitability Ratio
1. Rate of return on sales (ROS) =
= 3,021.00 / 40,386.00 =7.48%
Industry=5.29%
Sector=5.92%
Rate of return on net sales (Profit Margin) shows the percentage of each sales dollar earned as net income. The percent in Kraft Foods is 7.48%. It is higher than the industry ratio and Sector. It means, Kraft Foods does well in this point, the company will get large benefits.
2. Rate of return on total assets (ROA)
=
= (3,021.00 + 23.00) / [(66,714.00 +63,173.00) / 2] = 4.69%
Industry=2.62%
Sector=3.13%
Rate of return on total assets (ROA) measures how profitably a company uses its assets. Through the ratio has not higher than 5%, it is much more than the ratio in industry and sector. It means, Kraft Foods is very good.
- Rate of return on common stockholders’ equity (ROE)
=
= (3,021.00 - 0) / [(25,876.00 +22,295.00) / 2] = 12.54%
Industry=5.69%
Sector=8.22%
This ratio shows how much income is earned for every $1 invested by the common stockholders. The ratio in Kraft Foods is much higher than the ratio in industry and sector. It means the shareholders will get more profit.
- Earnings per share of common stock (2009)
=
= (3,021.00 - 0) / 1,477.88 = 2.04
Earnings per share of common stock (2008)
=
= (2,884.00 - 0) / 1,469.30 = 1.96
EPS increase 4.08% in Kraft Foods. It is not a bad percent. Many company was decrease in 2009 because of the financial crisis. It means Kraft Foods have a good potential in the future.
- Basic earning power ratio (BEP ratio)
=
= 5,524.00 / 66,714.00
= 0.08
Basic earning power ratio which measures the business' ability to generate profit of assets from conducting its operations. Kraft Foods’ ratio is 0.08, it means Kraft Foods can get profits.
4.6.5 Market value ratio
- Price/earning ratio (P/E ratio)
=
= 30.34 / 2.04 =14.87
Industry=42.14
Sector=27.45
Compared with the industry and sector, we find the P/E ratio is much lower than the industry and sector. Price/earning (P/E) ratio is the ratio of market price per share to earnings per share. Shareholders usually use this ratio to evaluate the stock’s value.
- Dividend yield
=
= 1.16/ 30.34 = 3.82%
Industry= 1.69%
Sector=1.82%
Dividend yield shows the percentage of a stock’s market value returned as dividends to stockholders each period. Kraft Foods’ dividend yield is much higher than the industry’s. It means that Kraft Foods’ shareholders get higher than industry level.
- Book value per share of common stock
=
= (25,876.00 – 0) / 1,477.88 = 17.51
This figure is the bigger the better.
4. Market/book ratio (M/B ratio)
=
= 30.34 / 17.51 = 1.73
Industry=1.05
Sector=1.68
Compared with the industry and Sector, we can find the number of Kraft Foods is the highest. And it plays a significant role in corporate financing decisions, showing the value of 1.73 million in year 2009 of a company.
5. Conclusions
According our analysis to the Kraft Foods Inc., we can see Kraft Foods’ financial is in a good situation. It starts come out of the shadow of the financial crisis.
First, let us look at the profitability. Rate of return on sales (ROS), rate of return on total assets (ROA) and rate of return on common stockholders’ equity (ROE) are all higher than the industry ratio. It means investors can get more profit from this company. Second, solvency is important. From analysis the cash flow situation and the relationship between different equity. We find Kraft Foods is health in long-term-Debt. But analysis the Quick ratio, we can see it less than 1, and it also much less than the industry ratio. It means Kraft Foods does not good at to pay back the current liabilities. The third is the growth potential. Compare with the revenue and operation income between 2006 and 2009. We can see in latest year the revenue decreased little but operation income increase much. It means that the company’ extended operation ability is very well. The last is the operational efficiency. From analysis the cash flow, we can see Kraft Food’ capital have a good utilization.
In conclusion, Kraft Foods performs well in financial.
6. Recommendations
Through the analysis and calculation, we predict the stock price of Kraft Foods Inc. will rise. Buy the company’s stock is a good way for investors to invest.
As we told before, the policy of quantitative easing was issued by Federal Reserve in recent time. It makes the price of food increased stable. And Kraft Foods performs well in the financial in last year. Under these favorable conditions, Kraft Foods’ stock must be favored by many investors. And it can push the stock have a higher price. So for most investors, Kraft foods Inc. is a proper corporation to choose from.
References