If all the previous income were spent on fish you would be able to purchase 20 fish, and if all previous income were spent on beans you would be able to buy 33 beans. However the income was increased, therefore the spending power, so the consumer was instead able to purchase up to 22 fish or 36 beans. Because the budget line has shifted outwards to accommodate the increase, it means that the equilibrium has also increased from 16.5 beans and 10 fish, to 18 beans and 11 fish. Due to the fact that 16.5 is not a whole number, it would be rounded down to 16. It can not be rounded up to 17 as that would go beyond the expected income. The indifference curve also shifts outwards on the new budget line, and the difference curve is situated at the equilibrium, assuming that the consumer purchases equal shares of both the beans and fish.
ii) The price of fish goes up by 25%
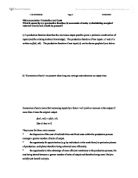
If the price of fish went up by 25%, the price of fish would go from £5 to £6.25. With an income of £100, the consumer would be able to purchase 16 fish. The amount of beans able to be purchased will remain the same, and 33 beans could be purchased with £100.
When the price of good increases, the consumer’s purchasing power will decrease and hence attainable utility will fall. The consumer’s choice of consumption will have an effective change. This can be displayed diagrammatically where the consumer’s budget line will change and pivot to accommodate for the price change. The indifference curve would also shift downwards, along the new equilibrium on the new budget constraint.
A change in a goods price will rotate the budget line. If there is a price increase, the budget line will rotate inward, if there is a price decrease, the budget line will rotate outwards, along with the indifference curve.
In this case the budget line rotates inwards along the Y axis where the price change has increased from £5 to £6.25, where the consumer’s attainable utility has fallen from being able to buy 20 fish to 16 fish.
This means that the equilibrium level has also changed and fallen with purchasing power, this can be displayed from the new indifference curve in bold. The equilibrium level for beans is still the same at 16.5; however the equilibrium for fish has dropped from 10 to 8.
- There is aggressive advertising campaign by fish sellers
If there were aggressive advertising, it would encourage people to buy more fish; this would lead to an increase in the amount of fish sold and a decrease in the amount of beans sold. Also seeing that there is already a preference to fish, it will simply encourage more people to buy fish. The budget line consequently would not be affected, as the income effect or a price change only effects it. However, it will have an effect on the indifference curve. The new encouragement to consumers may move the difference curve away from the equilibrium and move slightly to the left, holding a greater preference towards fish. An exact figure cannot be given to where the curve will move, as we do not no how much a preference the consumer may hold. The consumer may convert to fish completely and not buy any beans at all, however we do not have exact figures, therefore we just have to go on the assumptions of the consumer demand theory. Which says increased advertising, if in light if the consumer’s preference will move the indifference curve to satisfy the consumers needs.
- What are the weaknesses of the Hicks – Allen indifference curve analysis?
The aim of the indifference curve analysis is to analyse how a rational consumer chooses between two goods, or how a change in wage rates will affect the choice between leisure time and work time. It joins the combination of concepts of indifference curves and budget constraints.
In the 1930’s Hicks developed a theory of choice, which was based on the indifference curve analysis to derive the demand curve. Indifference curves represent the quantities of alternative goods, which give equal satisfaction, and budget lines constrain the options available. The analysis led to downward sloping demand curves as the price of goods reduced. Market demand is derived from the individual demand curves. In competitive markets although all consumers are different each and every one of them pays the price, which matches the value to them at the margin; otherwise they would buy alternatives. The availability of competitive alternatives is a key assumption.
One of the criticisms or weaknesses of the theory of the indifference curve analysis is that the utility itself is not measurable. There are many a number of models, which are based on the concept of utility maximisation, which are used to describe human behavior. The model is as follows;
Max U = f(x,y)
The x and the y on the right hand side are used to represent the measurable quantities of goods and services. However, consequently the term on the left-hand side is not observable or measurable. Therefore we have to resort to relying on the individual preferences for goods and services; to indirectly represent the utility or satisfaction gained from the consumption of these items. There are a number of assumptions made about these preferences, such that individuals are able to change and rank their preference fir different goods and services. That individuals are rational in the choices that they make; more is preferred to less; also that additional units consumed provide less additional satisfaction, relative to previous units consumed. This in other words is the concept of diminishing marginal utility.
Other preferences lie on the individual preferences. The indifference curve is mainly based on the assumption of personal and individualistic preferences. It does not however give us any information on the demands of the consumed products. The only aspects considered are the wants and needs of the individual. These wants and needs are determined by how much spending and purchasing power the consumer has, which are constrained by their personal income.
The indifference curve assumes that all real income is spent on consumed goods, however when all income is not spent, it can be used in conjunction with the following allowance of income. Thus increasing the spending power of the individual.
Preferences are not the ideal or efficient way to determine how much of a good is consumed or sold. It is mainly determined by the demand of a good. Demand can be estimated through a number of methods such as interviews or marketing methods, these are however sometimes misleading or biased. In which case tables tend to be drawn to find the demand of goods from previous years, which help give a rough prediction of sale for the on coming years.
The main determinant of demand is through price change, with other factors involved. The demand relationship can be written as:
Q = a – bP + cI
Where a, b and c are constants. P stands for price and I stands for income. The income term allows the equation to shift parallel from the demand curve. Price and income are interdependent factors.
There is also the issue of consistency. People may not be consistent in what they purchase. The indifference curve analysis assumes that a person’s preference does not change. However for example if a person who split their income between fish and beans suddenly became a vegetarian, their preferences would be completely altered. The consumer will now only consume beans or may even turn to a substitute good.
Another weakness of the indifference curve analysis is that it is assumed that the increase in the price of a good leads to a decrease in consumption. This is not true in all seen cases, as a price rise does not always lead to a decrease in consumption. There are other factors involved such as brand loyalty and ‘snob’ goods. The assumptions of brand loyalty are that although the price of a good may increase, their consumption of the good may not. They simply spend more of their income to buy more of the good, implying almost a loyalty to the good – brand loyalty.
The concept of snob goods is similar. When the prices of some goods shoot up incredibly, for the example the price of a TV, demand may tend not to decrease. This is where consumers may have a preference to expensive goods, and tend to but goods in demand regardless of a price change.
On an overall basis, you can see that there are many weaknesses to the indifference curve analysis, as preferences are not enough to determine what people demand, and how they may tend to maximise their utility.