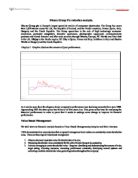
Closing Share price on 10-Jan-2000 : 501p
No of shares in issue : 1873.580m
Market Capitalisation on 10-Jan-2000 : £9396m
2. The Financial statements
There are two traditional types of financial statements, the balance sheet and the income statement. Of the two traditional types of financial statements, the balance sheet relates to an entity's position, and the income statement relates to its activity.
The balance sheet
The balance sheet provides information about an organization's assets, liabilities, and owners' equity as of a particular date (such as the last day of the accounting or fiscal period). The format of the balance sheet reflects the basic accounting equation: Assets equal equities. Assets are economic resources that provide potential future service to the organization. Equities consist of the organization's liabilities together with the equity interest of its owners.
Assets
Assets are categorized as current or long-lived. Current assets are usually those that management could reasonably be expected to convert into cash within one year; they include cash, receivables, merchandise inventory, and short-term investments in stocks and bonds. Long-lived assets encompass the physical plant—notably land, buildings, machinery, motor vehicles, computers, furniture, and fixtures. Long-lived assets also include real estate being held for speculation and intangibles such as patents and trademarks.
Liabilities
Liabilities are obligations that the organization must remit to other parties, such as creditors and employees. Current liabilities usually are amounts that are expected to be paid within one year, including salaries and wages, taxes, short-term loans, and money owed to suppliers of goods and services. Noncurrent liabilities are usually debts that will come due beyond one year—such as bonds, mortgages, and long-term loans. Whereas liabilities are the claims of outside parties on the assets of the organization, the owners' equity is the investment interest of the owners in the organization's assets. When an enterprise is operated as a sole proprietorship or as a partnership, the balance sheet may disclose the amount of each owner's equity. When the organization is a corporation, the balance sheet shows the equity of the owners—that is, the stockholders—as consisting of two elements: (1) the amount originally invested by the stockholders; and (2) the corporation's cumulative reinvested income, or retained earnings (that is, income not distributed to stockholders as dividends), in which the stockholders have equity.
The income statement excludes the amount of assets withdrawn by the owners; in a corporation such withdrawn assets are called dividends. A separate activity-oriented statement, the statement of retained earnings, discloses income and redistribution to owners.
Income Statement
Income Statement is the traditional activity-oriented financial statement issued by business enterprises. Prepared for a well-defined time interval, such as three months or one year, this statement summarizes the enterprise's revenues, expenses, gains, and losses. Revenues are transactions that represent the inflow of assets as a result of operations—that is, assets received from selling goods and rendering services. Expenses are transactions involving the outflow of assets in order to generate revenue, such as wages, rent, interest, and taxes.
A revenue transaction is recorded during the fiscal period in which it occurs. An expense appears in the income statement of the period in which revenues presumably resulted from the particular expense. To illustrate, wages paid by a merchandising or service company are recognized as an immediate expense because they are presumed to generate revenue during the same period in which they occurred. If, however, the wages are paid to process merchandise that will not be sold until a later fiscal period, they would not be considered an immediate expense. Instead, the cost of these wages will be treated as part of the cost of the resulting inventory asset; the effect of this cost on income is thus deferred until the asset is sold and revenue is realized.
In addition to disclosing revenues and expenses (the principal components of income), the income statement also lists gains and losses from other kinds of transactions, such as the sale of plant assets (for example, a factory building) or the early repayment of long-term debt. Extraordinary—that is, unusual and infrequent—developments are also specifically disclosed.
Cash flows
A third important activity-oriented financial statement is the statement of cash flows. This statement provides information not otherwise available in either an income statement or a balance sheet; it presents the sources and the uses of the enterprise's funds by operating activities, investing activities, and financing activities. The statement identifies the cash generated or used by operations; the cash exchanged to buy and sell plant and equipment; the cash proceeds from stock issuances and long-term borrowings; and the cash used to pay dividends, to purchase the company's outstanding shares of its own stock, and to pay off debts.
3. Ratios analysis
1.ROCE (Return on Capital Employed
This is a fundamental measure of business performance and expresses the relationship between the net profit generated by the business and the long term capital invested in the business (Peter Atrill et al, 1996). It is the indicator of the investment profit.
x100
-
The ROCE ratio of Scottish Power has drastically fallen more than 6% from last year performance. That means the long term capital invested didn’t quite succeed the company’s expectation and the return was less than 1998. From the figures it is clear that the net profit was more than 1998 but the Capital employed in 1999 was nearly £1000 m more that is way the profitability was less.
- National Grid had managed to increase their ratio by doubling the Capital Employed in 1999 and at the same time have a similar increase to the net profitby 0ne third and at the same time have the half net profit in comparison to 1998 achievement.
- A comparison of the companies ratios shows that they use the same strategies. Scottish power decided to invest more and took less and National Grid spent more to but also earn more. That means that National Grid made better investments or more careful.
2.Return on Owner’s Equity
This ratio compares the amount of profit for the period available to the owners to the owner’s stake in the business. This indicates the ratio of profitability for the owners in relation to the assets invested in the company. That means the return which ordinary(equity) shareholders received from their investment in the business. (Peter Atrill et al, 1996).
x 100
- The figures shows that in 1999 although the ordinary share capital was slightly dropped the net profit was nearly triple from 1998 and that is way the ratio was in result more than triple. That means that share capital was better explode than the capital employed in 1999.
- The share capital was almost doubled and the net profit slightly doubled ,too. The result was the 1998 ratio from 40% to become 70% in 1999. That means that the company used the share capital successfully 1999 and achieved their expectations.
- A comparison between the two companies will show that they both had the same result but with different way. The first reduce their share capital to achieve their goals while National Grid invest more.
3.Gross Profit Margin
This ratio relates the gross profit of the business to the sales generated for the same period. This measure is a measure of profitability since gross profit is the difference between sales and cost of sales. It is important that this ratio is quite high since it is a major indicator of profitability and profits are the generator of every business( Peter Atrill et al, 1996)
x 100
- Despite the differences between the two previous ratios the gross profit which is the indicator of profitability remained the same with a narrow increase . That was due to the fact that the increase of the gross profit was more than the increase of sales in 1999 .
- The same result was for the second company in 1999 but with a small fall in sales and a bigger increase in gross profit.
- The two companies had the same result of increase in 1999. The thing to watch is that the figures of the first company used for the calculation of the ratios are two times more than the second.
4. Net Profit Margin
This ratio relates the net profit for the period to the sales during that period. It is one of the most important ratios understanding the profitability of the company. It is the most appropriate measure of operational performance . ( Peter Atrill et al, 1996)
x100
- It will useful to make at this point a comparison between the company’s gross profit . In 1999 the net profit of the company was twice as many as the 1998 net profit and 1999,1998 gross profit, too. At the same time the sales remained the same. The conclusion is that the company found a way of cutting the cost for their remarkable benefit.
- The figures of the second company are equal between the two years.
- A comparison between the two companies at this point is very informative because although National Grid had the half sales of Scottish power managed to overtake the net profit of N.Grid. it clear now, that they better how to make investment that pay back.
5.Asset Turnover Ratio
It indicates the effectiveness of the company’s assets of the business by examining the assets employed in generating sales revenue. The higher the ratio the more sales are being generated by the assets employed. ( Peter Atrill et al, 1996)
- there is a narrow fall to this ratio in 1999 but it is due to the bigger increase of fixed assets comparing to the smaller increases in sales and current assets.
- There is a significant fallen 1n 1999 due to the six times increase of the current assets from 1998. Comparing that to the figure of sales and fixed assets which remained nearly the same it will give the reason for the drop consider that a lot of funs where tied up .
- Both the companies had a fall in 1999 but it seams that the first company used the assets employed better. Of course with an enormous figure of fixed assets.
6.Stock Turnover Period
The Average stock turnover period measures the average period for which stocks are being held.( Peter Atrill et al, 1996)
x365
c. Comparing these ratios we realize that there is a huge difference between the companies. First of all the first one had two times more cost of sales than the second and then held the stock ten times more. That means that funds were tied up could been used for profitable purposes
7.Average Settlement Period For Debtors
The Average Settlement Period for Debtors calculates how long, on average, credit customer take to pay the amounts which they owe to the Business (Peter Atrill et al, 1996).
x365
C. For both the companies these ratios almost remained the same from 1998 to 1999. The only thing to consider is that National Grid’s credit customer take less days by half to pay the amounts they own.
8.Average Settlement Period For Creditors
This ratio measures how long, on average, the business takes to pay its trade creditors (Peter Atrill et al, 1996).
x365
c. the Scottish Power ratios remained the same and it is a reasonable number that shows constituency considering the kind of industry that represents. The National Grid ratios it quite impressive but it is common sometimes in this kind of industries. Of course a very high ratio can result in a loss of good will by suppliers and a delay in future supplies loss of discounts etc.
9.Current Ratio
This ratio compares the ‘liquid’ assets of the business with the short-term liabilities (Peter Atrill et al, 1996). An ideal ratio will be two times.
c. For the first company this ratio remained the same with a slight increase from 1998 to 1999. National Grid on the contrary had an remarkable increase (4 times more) due to the fact that the current assets was five times more in 1999 and this may suggest that there was a lack of cash or other liquid assets.
10.Acid Test Ratio
This test represents as more stringent test of liquidity, since it omits stocks form the equation. (Peter Atrill et al, 1996)
c. The facts her are the same with the previous ratios. This ratio must always be considered along the stock turnover period because some times like from National Grid’s 1999 ratio it seems that there is a problem with liquidity but it depends on the kind of industry and the stock turnover ratio for a stock-in-hand to be converted quickly in cash.
11.Operating cash flows to Maturing obligations
This ratio compares the operating cash flow to t he current liabilities of the business. It provides a further indication of the ability of the ability of the business to meet its maturing obligations the higher this ratio is the better is the liquidity of the company. (Peter Atrill et al, 1996)
a. From this low ratio and the two previous, both for 1999 and 1998 it is clear that the first company is facing a liquidity problem. In this particular ratio it is clear a fall both in current liabilities and operating cash flows figures.
b. National Grid seem to face a problem with liquidity, too as there was a big increase in 1999 to the current liabilities.
12.Gearing Ratio
This ratio measures the contribution of long-term lenders to the long term capital structure of a business. It is a very useful ratio for the managers which managers has to consider when making financing decisions. The relationship between the amount of the business and the amount contributed by outsiders has an important effect on the degree of the risk associated with business. (Peter Atrill et al, 1996).
x 100
- Scottish Power made a great improve of the borrowing strategy in 1999 although the ratio is still high and still depend a lot on borrowing fund. This ratio has an effect on the returns equity ratios which was on the contrary increased three times more since 1998.
- National Grid on the contrary increased their high ratio in 1999 and that may be an indication that a borrowing cut will lead to problem ensuring the continuing operation. This high ratio is also a result of the long period politics of the company pay back to debtors.
- There is a big difference in 1999 borrowing stratey for the companies . Scottish Power seems to make Remarkable steps to improve their borrowing position on the contrary National Grid is worsen their position but counts on the big increase of equity returns.
13.Interest Cover Ratio
This ratio measures the amount of profit available to cover interest payable.
c. Both companies have low ratio that indicate a difficulty of repaying their loan.
14. Dividend Per Share
The dividend per share ratio relates the dividends announces during a period to the number of shares in issue during that period. (Peter Atrill et al, 1996)
15.Earnings per Share
The earnings per share of a company relates the earnings generated by the company during a period, and available to shareholders, to the number of shares in issue(Peter Atrill et al, 1996)
C Both companies had an significant increase of the ratio in 1999 which will help to assess the investment potentials of a company’s share.
16,Price Earning Ratio
The price earning ratio relates the market value of a share to the earnings per share (Peter Atrill et al, 1996).
c. this ratio reflects that the capital value of the share is 11.8 times higher than its current level of earnings for the first company and 6.76 for the second.
4. Additional Information that Would have been of Use
1.pricing policies were not provided. Such information would indicate if there were any changes in pricing that would have resulted in lowering sales volume and profitability
2 inflation rates were not available. Such information is important for understanding profit, and adjusting figures to reflect the rate of inflation during the period in question. What might appeared as good growth if compared with inflation rate might appeared a decline.
3 the number of share in issue ratio which would have provide an indication of the cash return which an investor receives from holdings company’s shares .
Financial ratios calculations
1.Overall performance
*capital employed = total assets – current liabilities
p. d = preference dividend
2. Profitability
3. Efficiency
4. Liquidity
Creditors due with in one year
* excluding stock
4.Capital structure ( Risk ratio)
5.Investment ratios
*available to ordinary equity shareholders
5.Financial statement overview
6.Reference:
Peter Atrill and al, Financial Accounting for Non Specialists, Pr. Hall, London, 1996
Hoover online
Information taken by hoover online

![National Grid Group (The) PLC[1] - Case study.](https://mbt-essays-prod-public.s3.eu-west-1.amazonaws.com/51489/listing/51489_1.jpg)