In 2003, the net profit margin was 5.22% and has increased tremendously to 10.31% in 2004. This is due to the huge rise in net profit. The rise in net sales has also contributed as it has cushioned the effect of the rise in total expenses.
The net profit margin has reduced significantly from 10.31% in 2004 to 5.27% in 2005. There was a significant fall in net profit and was due to the increase in total expenses particularly the increase in wages expenses. The fall in net sales has also contributed the fall in the net profit margin in 2005. If this trend continues, the net profit margin will soon fall drastically and will be unfavorable to the business.
2.4 Return on Equity
The return on equity presents the return on the owner’s investment. The higher the ratio percentage of return on equity, the better the business is performing.
Return on Equity = __Net Profit__ × 100%
Owner Equity
The return on equity in 2003 was 4.1% and has increased significantly to 8.4% in the following year of 2004. This is due to the rise in net profit. This rise in net profit is due to the rise is net sales and concurrently due to the fall in cost of sales. Thus, improves the business return on equity in 2004.
In 2005, the return on equity was 4.08%. This falling trend is due to the fall in net profit and also the rise in average owner’s equity. The fall in net profit is due to the fall in net sales in as well as the rise in cost of sales. Total expense has also risen which contributed further to the falling trend. If this trend follows suit in the following year, the return on equity will fall significantly as well.
2.5 Return on Total Assets
The return on assets indicates the business ability in utilizing its assets to generate profit and by adding interest; it excludes the effect of the financial source used in obtaining the assets. The higher the ratio, the better the business is doing.
Return on Total Assets = Net Profit + Interest Expense × 100%
Total Assets
The return on assets in 2003 was 4.65% and has increased to 7.68% in 2004. Although interest expense has fallen in 2004, the rise in net profit has cushioned the effect of the fallen interest expenses as well as the rise in average total assets.
In 2005, the return on total assets was 4.12%. This significant fall was due to the fall in net profit and also the fall in interest expenses. The fall in average total assets had not managed to cushion the effects of the net profit and interest expenses. If this situation continues, the return on total assets will drop significantly as well.
3.0 Financial stability
3.1 Liquidity
Liquidity refers to the capacity of the business to be prepared for any cash disbursement without any burden on where to get some money. In other words, liquidity measures the availability of cash in times of uncertainty or in times of unwanted cash outlay of a business. This aspect is very important in any kind of business. There are two indicators of indicating the liquidity of a business that is working capital ratio and quick asset ratio.
3.1.1 Working Capital Ratio
The working capital ratio indicates if a business has enough short-term assets to cover its immediate liabilities over the next twelve months. The formula is as shown below:
Working Capital Ratio = _Current Asset_
Current Liabilities
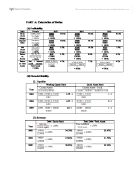
The working capital ratio has increased from 2.75: 1 in 2003 to 4.33: 1 in 2004. The increased of working capital ratio from 2003 to 2004 is largely due to the decrease in creditors. This decrease of creditors has resulted in drop in current liabilities. The increase of working capital ratio to a 4.33: 1 in 2004 is satisfactory as it indicates that the business is very liquid and shows that there are cash funds in the business to be invested in order to generate more revenue. The increase of working capital ratio also shows the business is able to meet ongoing and unexpected bills therefore taking the pressure off of the business cash flow. Being in a liquid position can also have advantages such as being able to negotiate better cash discounts with the suppliers.
However, the working capital ratio has decrease from 4.33: 1 in 2004 to 2.6: 1 in 2005 which is unsatisfactory due to the significant increase of creditors, which is part of the current liability. Therefore, this results in higher current liabilities. The business is a less liquid state then the year before and the business is having greater difficulties meeting its short-term commitments and that additional working capital support is required. Despite the difficulties, the business is able to pay their cash commitments within the 12 months period. If the trend of decreasing working capital ratio continues the business may lead to difficulties paying back creditors in the short term and eventually leads to bankruptcy.
3.1.2 Quick Asset Ratio
The quick asset ratio indicates the ability of a business to meet cash commitments due within 30 to 90 days. The formula is as shown below:
Quick Assets Ratio = Current Assets – Stock z
Current Liabilities – Bank Overdraft
The quick asset ratio has improved from 1: 1 in 2003 to 2: 1 in 2004. The improvements of quick assets ratio is due to increase in cash at banks and debtors control, which are current assets. Therefore, this would increase current assets. Improvement in the quick asset ratio has indicate that the business is able to meet all cash commitments within the immediate short term because of the business is very liquid.
There has been decrease in the quick asset ratio from 2: 1 in 2004 to 1:1 in 2005. The decrease of quick asset ratio is because of a significant increase of creditors in 2005, which is a current liability. Therefore, this would increase current liabilities. The decrease of quick asset ratio has indicated that the business would face difficulty in meeting all cash commitments within the immediate short term because the business is less liquid but it is still able to full fill all the cash commitment.
3.2 Solvency
Financial solvency measures a business’s ability to meets its long-term fixed expenses. The solvency ratios measure business risk, which is the ability of a business to pay up the debts without any cash flow. Investors are very interested in these ratios because they indicate the amount of debt the business can handle. They also indicate the amount of investment the business have. There are 2 indicators for solvency that are Debt/Owner Equity Ratio and Debt/Assets Ratio.
3.2.1 Debt/Owner Equity Ratio
The debt/ owner's equity ratio indicates the degree of financial leverage that you're using to enhance your return. The formula is as shown below:
Debt/Owner Equity Ratio = __Liabilities_ x 100%
Owner Equity
The debt /owner's equity ratio has decrease from 34.19% in 2003 to 27.42% in 2004. This is caused by the reduced loan from National Bank, which is a liability. As liabilities lowers, the debt/owner equity ratio drops. The decrease is also due to an increase of owner equity as a result of increase in capital by the owner. The decrease in Debt /owner's equity ratio shows that the business is less geared and more reliant to internal funds. Debt/ owner's equity ratio of the business gearing level is ideal as it has not exceeded 100% and more reliant to internal funds.
The debt/ owner's equity has increased from 27.42% in 2004 to 30.25% in 2005 is caused by increase in creditors. Therefore, this has increase liabilities. This shows that the business is more geared and indicates a greater reliance to external sources for funds. Yet, the increase in debt/owner’s equity ratio indicates that the business is still maintained at satisfactory level as it does not exceed 100%.
3.2.2 Debt/Assets Ratio
The debt/assets ratio has indicates the percentage of assets or funds provided by external sources. The business would try to maintain the ratio below 50%, which indicates the business is more reliant to internal funds to finance the business. The formula is as shown below:
Total Debt/ Total Assets = Total Liabilities x 100%
Total Assets
The debt/assets ratio has decrease from 25.47% in 2003 to 21.52% in 2004, largely because of reduction of loan from National Bank and creditors, both contributed to the reduction in liabilities. The decreasing debt/ assets ratio indicates that the business is becoming less geared. Furthermore, the business is more secured for creditors in an event of liquidation. The business debt/assets ratio is still satisfactory as it does not exceed 50%.
The debt/assets ratio has increase from 21.52% in 2004 to 23.23% in 2005, which is caused by the increase in creditors. Thus, this would increase the amount of total liabilities. Furthermore, the increase of debt/assets ratio is contributed by the reduction premises, which reduces the amount of total asset. This indicates the in 2005 the business is more geared than before. The increase also indicates a greater reliance on external sources to finance the business. However, the business debt/assets ratio is still satisfactory as it does not exceed 50%.
4.0 Management Effectiveness and Procedures
If a business does not manage their assets effectively, investors in the business would rather take their money and invest in other places. In order to keep the assets to be used effectively, the business needs high turnovers. These management ratios may assist the business how the assets are used to generate revenue to the business.
4.1 Times Interest Earned
The times interest earned reflects how many times the profit earned by the business can over the interest expense. The ratio indicates the extent of which earnings are available to meet interest commitments of the business. A business would like a high ratio of times interest earned as a low ratio means less earnings are available to meet interest expenses. A ratio of 3 or more indicates that the business is using the borrowed funds efficiently. The formula is as shown below:
Times Interest Earned = Net Profit + Interest Expenses Times
Interest Expenses
The times interest earned ratio has increased from 2.92 times in 2003 to 6.05 times in 2004. This shows a satisfactory improvement as the net profit increases drastically. In addition, the interest expenses reduces, which contributes to the increase of times interest earned. This shows that the business has more ability to pay up their interest expenses.
However, the ratio dropped from 6.05 times in 2004 to 4.3 times in 2005. A great fall in net profit contributed to the reduction in times of interest earned, despite the fact that the interest expenses has reduced in 2005. Thus, the business is more geared. Yet, the business still shows a strong times interest earned ratio as it has maintained above 3 times interest earned as the benchmark, thus the business has been efficiently using its funds.
4.2 Debtors’ Turnover
Debtors’ turnover ratio reflects how effective the business is in collecting money owed by debtors. In other words, it reveals how efficient the trade debtors are being managed. It is important for the business to have a high or increasing debtors’ turnover rate because it will improve the cash flow and liquidity of the business. The formula is as shown below:
Debtors’ Turnover = Net Credit Sales (times/days)
Debtors*
*Average Debtors
In terms of days, the debtors’ turnover ratio is worsening from 19.8 days in 2003 to 29.8 days in 2004. Between 2003 and 2004, there was an increase in the net credit sales and average debtors. Yet, the number of times that average debtors increased exceeded that of the net credit sales. Therefore, number of times the debtors’ turnover decreased from 18.4 times to 12.25 times. This worsening in the debtors’ turnover shows that the business is becoming less efficient in collecting its debts.
The debtors’ turnover ratio continues to worsen from 29.8 days in 2004 to 31.1 days in 2005. Between 2004 and 2005, there was a fall in the net credit sales while the average debtors in the two years remained constant. The fall of the net credit sales resulted in the fall of the number of times a debtors’ turnover occurred from 12.25 times to 11.75 times. This worsening in the turnover rate shows that the business did not manage the debtors efficiently.
Although the decrease in debtors’ turnover over the three years is not favorable to the business, it is still acceptable as it is within a usual company’s policy. An average company’s credit policy is 30 days and the company did not exceed this number, except in 2005 by one day. Therefore, the company has a healthy debtors’ turnover rate. However, the company must be careful to ensure that the debtors’ turnover does not continue to decrease.
4.3 Stock Turnover
Stock turnover determines how well a business coverts stock into revenues or how efficient the firm is at producing and selling its products. Through the stock turnover ratio, accounting users can know how well the business is making use of its working capital that has been invested in stock. It shows how quick the stock is moving through the firm and bringing in sales. The higher the stock turnover is, the better it is for the company because it shows that the company is efficient in converting its stock into revenues. The formula is as shown below:
Stock Turnover = Cost of goods Sold (times p.a.)
Stock*
*Average Stock
In terms of days, the stock turnover has showed an increase from 92.64 days in 2003 to 94.81 days in 2004. This is because the average stock remains the same while the cost of goods sold had decreased. Thus, there is a fall in the number of times of stock turnover per year from 3.94 times to 3.85 times. This means that more days are needed in 2004 for the stock to move through the firm and generate sales due to the fall in the cost of goods sold. Hence, we can conclude that the fall in the cost of goods sold actually affects the stock turnover negatively. This is bad for the company because there is a fall in the number of times for conversion of stock to revenues.
The stock turnover continues to increase from 94.81 days in 2004 to 107.99 days in 2005. Comparing 2004 and 2005, there was an increase in the cost of goods sold and stock. Therefore, there is a fall in stock turnover from 3.85 times per year to 3.38 times per year. This indicates that there is a serious problem regarding the stock turnover. The problem with the stock turnover has become increasingly worse.
The worsening of the stock turnover reflects that there is a deterioration of the efficiency of management in the company’s stock control. The deterioration can be seen for three straight years and if it is not ratified as soon as possible, the company will face problems associated with liquidity. Apart from that, the products sold by the company may also get spoilt if it they have a short shelf-life.
PART C: Recommendation
5.1 Recommendation on Managing Debtors’ Turnover
In order to further improve the performance of the business in terms of debtors’ turnover, the business needs to take actions to improve it. According to the debtors’ turnover rate from year 2003 to 2005, the business is having a healthy turnover rate. However, it is worsening from year 2003 to 2005. Hence, measures have to be taken to prevent the debtors’ turnover from becoming worse and falls into an unhealthy stage.
Firstly, a good credit policy can be considered by the business to prompt debtors to pay up their debts. The policy should be with detailed procedures and regulations and the company will have to enforce the policy strictly. This can be done when invoices are issued on the spot when the sales are provided. This will increase the debtors’ turnover rate.
Besides that, debt collection should be managed systematically. The management or sales team should also update or remind their debtors about their debt. For instance, if the credit term is 30 days upon sales, when it reaches between 15 to 20 days after sales, the management should remind debtors that their debt will be due soon. Reminder given should also include information on the interests charged for late payments and the proposed date to collect the debts. This will avoid any confusion between the debtors and the business. To do so, a statement or a phone call will be appropriate. Through this process, the business will be able to portray a good image to the customers that they have a good attitude towards debts. This will lead to a better debtors’ turnover rate.
Apart from that, the business may also employ debt collector to collect debts. The sales collector should call up debtors to establish a way to collect the debts. This is to ensure the punctuality of the sales collection. Although this will increase the operating expenses, it can increase the efficiency of debt management. This will help to improve the debtors’ turnover and increase the cash flow of the business.
On top of that, the business should have a complete and detailed contact list of debtors. To do so, it is highly recommended that the business does computerized accounting whereby debtors listing and sales history of each debtor are recorded systematically. This allows the business to identify the debtors’ paying pattern and track them easily. If the debtor shows slow paying history, the company may need to reconsider their credit policy with the debtor as there is a high tendency for the debt being fault. Through this, business transparency will be enhanced and accounting fraud can be avoided. The business should regard this as a long term investment rather than an expensive expense as it allows the business to increase its efficiency on administrating collection of debt. This will indirectly contribute to a better debtors’ turnover.
In short, debtors’ management is essentially important to the business. It is only when the debtors clear off their debts, then only the business will have enough cash to manage other activities, such as paying its creditors. Hence, having a good debtor’s turnover is crucial to the business.
5.2 Recommendation on Managing Stock Turnover
In order to further improve the performance of the business in terms of stock turnover, the business needs to make decisions to improve its liquidity to address the worsening of the stock turnover from year 2003 to 2005.
Firstly, the business can improve its stock turnover by reducing the level of stocks held through the implementation of ‘Just in time’ (JIT) ordering system. This system enables the business to have an enough stock on hand so that it will be to meet customers’ demand without having excess idle stock. To do so, the business needs to look at the types of stock held and the demand for each of them. This system can help to reduce the costs of goods sold expense by cutting stock to a minimum, increase the stock turnover rate and improve the cash flow of the business.
Other than that, to increase stock turnover, the business should rotate the stock so that older stock is brought to the front. The method used is first in, first out system. It can ensure that perishable stock is used efficiently so that it does not deteriorate. Moreover, careful selection of the type of stock displayed is also important. The business needs to consider the seasonal nature, cost and complementary items of the stock in order to meet the demand of customers.
In addition, the sales policy also plays a crucial role in improving the performance of the business in terms of stock turnover. It has a strong influence on stock levels and should be managed with a view not just to achieve maximum sales. It can be directed towards a higher turnover of goods, selling goods bought at bargain prices faster and clearing slow moving items. As a result, cash flow and liquidity can be protected.
Lastly, the business can incorporate forecasting and inventory performance into the firm’s continuous improvement program, and measure, report, and review results against goals to be met. It is essential for the business to have a good stock management as in having a high stock turnover rate because the quicker the stock is turned into cash, the better the cash flow which will result in a better performance of the business. However, the longer the stock is held by the business, the longer the cash is held up in the form of an alternative asset and thus the greater the problem associated with liquidity. Hence, the business should have an overall stock policy that is appropriate to enable the business to function at maximum volume with minimum financial investment in stock.
(4047 words)
6.0 List of References
- http://www.extension.iastate.edu/agdm/wholefarm/html/c3-24.html
- http://www.bized.co.uk/compfact/ratios/profit3.htm
- http://www.financescholar.com/profit-margin-analysis.html
- http://www.investopedia.com/terms/w/workingcapital.asp
- http://www.anz.co.nz/calc/busfintools/working_capital.asp
- http://www.investopedia.com/terms/q/quickratio.asp
- http://www.investorwords.com/4008/quick_ratio.html
- http://www.business-plan-success.com/Articles/Formulas4/
- http://www.toolkit.com/small_business_guide/sbg.aspx?nid=P06_7305
- http://www.accountingformanagement.com/debtors_or_receivable_turnover_ratio.htm
- http://www.universalteacher4u.com/cbse/xii/acctheory/ch11/page2.htm
- http://www.indianmba.com/Faculty_Column/FC145/fc145.html
- http://www.bizwiz.ca/times_interest_earned_ratio.html
- http://www.businesslink.gov.uk/bdotg/action/detail?site=181&type=RESOURCES&itemId=1073792659
- http://www.streetdirectory.com/travel_guide/144194/trading/improve_cash_flow_by_managing_stock_levels.html
- http://www.tompkinsinc.com/publications/competitive_edge/articles/0107inventorytips.asp
- http://www.commbank.com.au/business/betterbusiness/case-studies/faster-stock-turnover/