II- TOTAL RISK-ADJUSTED RETURNS
6. Standard Deviation of Weekly Rates of Return
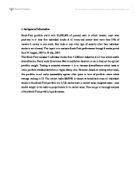
7. Sharpe Ratio
8. Performance Evaluation: Sharpe Ratio
Based on the Sharp Ratio, the Portfolio is underperformed the S&P500 since it is easily to catch that the Portfolio has lower average return and higher standard deviation which leads to significantly lower Sharpe Ratio.
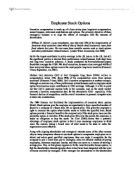
9. Ex-Post CML and CAL
10. M2 Measure
M2 = RP* - Rm
σp* = σm = Wp x σp = 2.3010
Wp = 2.1877/ σp = 2.3010/ 2.7317 = 0.8423
Wrf = 1 - 0.8324 = 0.1577
Portfolio P* (0.1577 RF, 0.8423 P) The adjusted Portfolio P* has 84.23% in Stock-Trak Portfolio and 15.77% in RF asset.
Rp* = Wp x Rp + Wrf x Rrf = 0.8423 * 0.28 + 0.1577 * 0.06 = 0.2453
M2 = Rp* - Rm = 0.2453 - 0.51 = -0.2647
We have negative M2 measure indicates that the capital allocation line CAL is less steep than the capital market line CML, and that is when the portfolio’s Sharpe ratio is less than of the market index.
IV. SYSTEMATIC RISK-ADJUSTED RETURNS
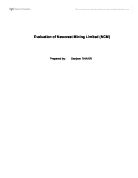
11. Jensen’s Alpha
Jensen’s Alpha = -0.194271791
Beta = 0.923888709
Overall regression interpretation
The regression has significant value p < .05 mean regression is statistically significant, we conclude that portfolio return and market return has significant relationship. Adjust R square equals 0.605636 means that 60.56% variance in Stock-Trak portfolio return is explained by market portfolio return which is statistically high number.
This portfolio is inferior performance since Jensen’s alpha is negative -0.194271791. However, this alpha value is not statistically significant different from zero because the t-statistic value is - 0.290261042 which absolute value is less than 1.96.
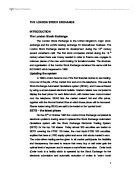
12. Treynor Ratio
Treynor Ratio of portfolio = (Rp – Rf) / β = (0.28 – 0.06) / 0.923889 = 0.23812
Treynor Ratio of market = (Rp – Rf) / β =(0.51 – 0.06) / 1 = 0.45
13. Performance Evaluation: Treynor Ratio: The portfolio is underperformed the market since Treynor Ratio of portfolio is less that Treynor Ratio of market.
14. Ex-Post SML
- UNSYSTEMATIC RISK
15. Information or Appraisal Ratio
Jensen’s Alpha = -0.194271791
Standard error σ (ep) = 1.852930522 measure the unsystematic risk
Information ratio = α p / σ (ep) = -0.10485
16. Performance Evaluation: Information Ratio
Information ratio measures abnormal return per unit of non-systematic risk that in principle could be diversified away by holding a market index portfolio. The information ratio is small and negative indicates that due to high unsystematic risk (high standard error) lead to negative impact on portfolio, increase portfolio variance and reduce abnormal portfolio return.
17. Fama Selectivity Measure
Beta β = 0.923888709
β* = σ p/ σ m = 2.7317 / 2.3010 = 1.187
E(RRR) = RF + β(Rm-Rf) = 0.48
E(RRR*) = RF + β*(Rm-Rf) = 0.55
18. Performance Evaluation: Information Ratio
CAMP β measures diversifiable risk only. If the portfolio is not fully diversified then use β* as the appropriate measure of risk.
Abnormal return = Rp – R(RRR)
Because β* > β, so E(RRR*) > E(RRR). Therefore, when the portfolio is not fully diversified, the abnormal return significant drops down.
- FAMA FRENCH APPROACH
Fama-French 3 factors
Interpretation
Abnormal return alpha = 0.194531which is not statistically significant since the absolute value of t-statistic is less than 1.96
The portfolio has positive beta with Market excess return X1 and Small-minus-big excess return X2 while it has negative beta with High-minus-large excess return
Fama French 3 factors and Momentum factor
Abnormal return alpha = 0.183956 which is not statistically significant since the absolute value of t-statistic is less than 1.96
The portfolio has positive beta with Market excess return X1 and Small-minus-big excess return X2 while it has negative beta with High-minus-large excess return, and positive beta with momentum factor.
Passive benchmark
Based on the Fama-French factors models, another passive suggested benchmark can be used is small and medium index which is R2000.
Current Benchmark Returns
The Small Neutral bench mark return for Sep 2007 is 0.86. Therefore, the portfolio return which is 0.28 is underperformed the benchmark.
- OTHER MEASURE
Gruber Model
(rP,t - rft ) = αP + β1*(rM - rft) + β2* SML + β3*HML + β4*(Bond index -Rf)
Abnormal return alpha = 0.049918 which is not statistically significant since the absolute value of t-statistic is less than 1.96
3. CONCLUSION
In conclusion, the Stock-Trak portfolio is underperformed market index S&P500 because Stock-Trak portfolio has lower Shape Raio, lower Treynor Ratio. Moreover, the Portfolio also underperformed the other passive benchmark R2000. One possible reason is because the Stock-Trak portfolio has high unsystematic risk which should be eliminated by diversifying. The other reason is because the underlying method use for trading is trading strategy, investor used momentum to predict the stock price in short-term. Instead of focusing on diversification, investor tried to out-perform the market by momentum and analysis skills toward company information. However, based on weak-form of market efficiency, this method is useless since all past information is already reflected in current stock price. Therefore, to improve performance, investor should try to more diversify the portfolio.
Risk-free rate Fama-French model is 0.018 from Ken French webside
Risk-free rate Fama-French model is 0.018 from Ken French webside
Risk-free rate Fama-French model is 0.018 from Ken French webside