1.2
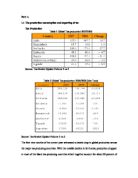
Table 4 Average tea prices (US $/kg)
Source: Tea Market Update Volume 4 no 2
Going through the table 1 and 4 it is clearly identified the relationship between individual growers and price of tea market of the world. As an example Sri Lanka and India has provided the largest production in the year of 2008 and it has directly influenced of the price of the tea. As an example India has done 345.7 with Sri Lanka respectively on 171.3 with a significant increase compared to 2007 which has resulted and increase in tea prices (Colombo 3.12, Kolkatta 2.57)
1.3
There is a significant amount of influence from those trans-national corporations in the global tea market, those companies putting fair amount of pressure on the local growers and the manufactures with bulk buying during the auctions. Those companies comprise with enough resources to own plantations and processing factories from deferent countries and make their own brands to create a monopoly in the tea market. For instance TATA tea limited is a major player in both Indian and global market as well,
According to TATA Tea Limited along with its subsidiary companies has a significant presence in over 35 countries worldwide. It owns 51 tea estates in India and produces over 60 million Kg of black tea.
Their quality products, right from the tea bush to the cup, has made Tata Tea one of the largest selling brands in India, which is the largest black tea market in the world. Everyday over 64 million cups of Tata Tea teas brightens up the day for its consumers.
The Global Business Division in has three main lines of business, Branded Tea, Bulk Tea, and Spices.
Moreover, global payer Unilever merge with number of African tea plantations such as Unilever tea Kenya limited formally known as the Brooke bond Kenya. The name was changed to Unilever Tea Kenya Ltd. (UTKL) in 2004. Today UTK is one of the largest commercial enterprises in Kenya providing employment to more than 20 000 people. Which is acting a major role in the Kenyan economy currently. As a whole these trans- national organizations have a great influence in this industry.
Question 2
According to Tea market update during the period from 1997 to 2006 the global tea production rose by an average of over 3.4% per year whilst the consumption rose only by an average of around 2.8%. This imbalance in the supply and demand pattern of the global tea industry pressurized the tea prices to decline. However, the reversal of the situation since 2006 saw tea prices improving steadily. But the Food and Agricultural Organization (FAO) has cautioned the tea producing countries not to over react to these high prices by increasing the land area under tea. The FAO predicts global black tea production to increase by 1.9% annually to reach 3.1 billion kilograms in 2017 whereas green tea production to increase at a higher rate of 4.5% annually. This has been predicted taking into account of the reported program for production expansion in China. However the rate of production of black tea has been slowed compared to the last decade. According to FAO projections, India is expected to continue to be the largest producer of black tea with a projected annual growth rate 2% in the next decade whilst Kenya and Sri Lanka with a similar growth rate of around 1% will have an annual production hovering around 340 million kilograms.
For instance, Sri Lankan tea production went downstream from 2007 to 2009 however, according to tea market update volume 5 tea prices at the Colombo auctions went up comparing to the other years: average prices are shown below.
2006 price average- Rs. 199.58 per kg.
2007 price average- Rs. 279.44 per kg.
2008 price average- Rs. 310.81 per kg.
2009 price average- Rs. 384.00 per kg.
There are three distribution channels can be identify in the Sri Lankan tea industry, public auction, private sales and direct sales.
Source: Tea Market Update Volume 5 no 3
According to above table regarding the three distribution channels, Comparing to 2008 there is a clear price increase in 2009 third Quarter. Even though there is less Qty in private sales and direct sales.
The quantity sold at the Colombo auction during the quarter-recorded 74.4Mkgs. While average prices fetched its highest record level of Rs.405.77 per kilogram, The reasons attributed to achieve such a high average price level is due to substantial production deficits recorded locally coupled with poor crop in Kenya and India as well as higher demand created from Gulf region due to increase oil prices. Replenishment of low inventories by foreign buyers also contributed positively.
Even though, there was a high demand and high price in the market the production was less comparing to the other quarters, the production was less due to Effects of dry weather and work stoppage condition has reduced tea output in high and mid grown, which account for more than 40 percent of country’s tea production.
In the July–September period crop was recorded at 74.5 million kilograms which is a 4.8 percent drop compared to the same period of last year. The worst affected was Eastern slopes of Uva side of the high grown due to strong winds which retarded the shoot formation resulting in a production decline unexpectedly. Third quarter production of 74.5Mkg is the lowest record compared to the last two years surpassing the previous record of 73.6Mkgs in 2006.
Moreover, the Sri Lankan economy grew, in real terms, by 1.8 per cent during the first half of 2009. This is an encouraging development as it was achieved despite the adverse impact of the global economic slowdown in the backdrop of the global financial crisis, which resulted in a negative growth in many countries.
Question 3
According to Wikipedia in economics market power is the ability of a firm to alter the market price of a good or service. A firm with market power can raise prices without losing all customers to competitors. When a firm has market power it faces a downward-sloping demand curve.
In perfectly competitive markets, market participants have no market power. A firm with market power has the ability to individually affect either the total quantity or the prevailing price in the market. If the demand curve is downward sloping (that is, the most common situation where price increases lead to a lower quantity demanded), then the decrease in supply as a result of the exercise of market power creates an economic deadweight loss in comparison with a situation of perfect competition.
Except for the temporary crisis the industry experienced during the last quarter of 2008 with tea prices tumbling to an unprecedented low, due to the global economic melt down coupled with the international credit squeeze and the depreciation of many currencies of large Ceylon tea buying nations, the sector has performed creditably. Commencing from the last quarter of the year 2006, tea prices at the Colombo Auctions reflect remarkable buoyancy.
Well known quality of the Sri Lankan tea products gave a remarkable competition with a higher price thus, there is no alternative to mach the need of such a quality product from the other competitors. Even though there is price hoist in the global market for the Ceylon tea it doesn’t show a flow of that profit markup all the way down to the hierarchy.
According to tea market update the decline in domestic tea production has had a significant impact on exports quantity. During the third quarter 2009 Sri Lanka exported 81.9Mkgs of tea at an average price of Rs. 493.85 per Kilogram. However due to unit F.O.B. price increasing monthly assisted earnings to reach Rs.40 billion in this quarter. Meanwhile, earnings from green tea, other tea, and re-exports decreased substantially by Rs, 7 billion during the first nine months of 2009, due to both lower export volumes and reduced pricing. A striker regulator negatively prevailed upon importation. The largest contribution to this quantity decline was from the tea packets (7.2MKgs) followed by the bulk tea exports (7.1Mkgs).
These figures illustrate there is a significant number of middle parties in this business and major share of the profit split among them rather than price rise for the tea growers and the workers in the industry. When production downturn in tea industry the lower level workers and plantations will affect straightly with profit loss and less earnings, hence due to the demand in the market the price will remain high but not for the manufactures. Meanwhile, the Sri Lankan tea workers were demanding for 75% wage rise to an equivalent of $4 a day to avoid poverty. This statement clearly shows that price hike in the market for the Ceylon tea doesn’t help those estate workers.
There are some other facts can be identified for this price hike for Ceylon tea in the global market such as; poor crop in Kenya and India as well as higher demand created from Gulf region due to increase oil prices.
Moreover, DILMA is a well-known tea brand from Sri Lanka and intervention of DILMA has taken out the possibility, which small growers had in terms of profit sharing.
Word Count 1964
Bibliography
Sri Lanka Tea Board. 2008. The Tea Market Update Volume 4. [online]. Available at: [Accessed 14 November 2009].
Sri Lanka Tea Board. 2009. The Tea Market Update Volume 5. [online]. Available at: [Accessed 14 November 2009].
Smith and Zimmerman. 2009. Managerial Economics and Organizational Architecture. [online]. Available at: [Accessed 18 November 2009].
Tea Board of Kenya. 2005. [online]. Available at: [Accessed 15 November 2009].
Tea Board of India. 2007-08. [online]. Available at: [Accessed 15 November 2009].
Tata Tea Limited. 2002. [online]. Available at: [Accessed 17 November 2009].
Unilever. 2007. [online]. Available at: [Accessed 17 November 2009].