TRADING STRATEGIES
Our investment horizon started from February, 3, 2011 and ended at April, 6, 2011. During this period we have seen the market situation, analyzed different company stocks and selected our optimum portfolio using different theories. We not only looked at the profitability but also at the reliability and stability of stocks. Our investment period was divided into three time phases and we had to select different portfolios at different phases.
Our investment horizon is mainly based on “top down investment” approach. The investor using a top down investment approach looks at the big picture. Macro economic variables such as the global economy and individual country statistics such as , trade balances, currency movements, , interest rates, are used to determine where to invest and in what types of assets. The idea in a top down approach is to weigh broad macro variables and then shift investments accordingly i.e. to make money by shifting assets rather than by analyzing companies. Picking individual securities is usually the last step in this strategy. We have focused on company’s monetary condition as well as forecasting of future financial price movements and trends based on an assortment of market activity.
Stock selection-
1st Phase:
At the first phase we had very little knowledge on theoretical stock selection process, still we selected the stocks based on the industry stability, low P/E ratio and previous company dividend payout trend of different stocks.
Square Pharmaceuticals Ltd.: We have selected it based on its performance and expected future growth. It’s not making profit but the reason behind it for selecting is its P/E ratio, which is somewhat lower among the pharmaceutical and chemical industries.
ACI Limited: Their P/E was relatively stable and their earnings per share increased over the years for which I have selected this stock.
Bangas and British American Tobacco Bangladesh Company (BATBC): Though their price to earnings ratio is low, they paid relatively higher dividends. Dividend yield is good over the years which made us take this share. Its earnings per share (EPS) have increased compared to the last quarters. BATBC has been maintaining consistency on prices over the years. Its basic EPS has increased greatly over the years. Very appealing P/E ratio and its price is in the lower area right now hopefully will increase a huge within a few days.
AMCL (Pran): Its current price is at the lower side of Price index and has a trend of moving upward, so it seems appealing also that EPS, dividend, and P/E ratio is in a satisfactory level. They ensure a higher dividend policy and their dividend percentage is really high. And its trading graph shows they trade shares at a considerable amount every day.
Bata Shoe: Their EPS was more or less high. Moreover their net profit after tax increased over the years. We also know that the demand for Bata shoe is good in our country which has caused its EPS and Net profit after share to increase.
Samorita Hospital: We thought that we would diversify our investment among different industries for which we have taken one industry from services and real estate. The main reason for choosing it is their increasing Earnings per share (EPS) and lower P/E ratio over the years.
Green Delta Insurance: Its profit has been increased in the recent years and its EPS is also increasing throughout the year which is satisfactory. We have taken only one insurance company from the insurance sector to diversity our portfolio. And we also know that nowadays, insurance companies are having high price increase.
Dutch-Bangla Bank LTD.: Banking sector is considered to be the safest sector for investment as their market risk is lower and we will get a return though the return may be low but their dividend growth rate is always satisfactory and their profitability growth is always visible and stable.
Mutual Trust Bank LTD.: For Mutual Trust bank, the market price has fallen shortly but we can say that it will be increased quickly in the market as per our analysis. Dutch-Bangla bank is a more risky stock but we are buying the stock because its basic EPS, based on continuing operations in the last quarters is also highly increasing.
Dhaka Electric Supply Company and Titas Gas Transmission & Dist. Co. LTD.: Fuel and power sector is a very strong sector. It’s a necessary commodity in our country so we have chosen it for our portfolio. Both of the companies EPS and Net profit after tax are relatively high and stable. Though market price of Titas gas throughout the recent days is not satisfactory but it has earned a good margin of profit in last year.
Navana CNG LTD.: As per our market analysis the net profit after tax for the continuing operations and also the basic EPS over the quarters have increased.
Grameenphone LTD.: As the prices of it have fallen in the recent days; in the coming days, it will go higher as per our market trend analysis. Moreover a higher EPS has caused us to select it.
IDLC Finance LTD.: Heavy EPS and dividend is on current 10% price. It is falling as a normal function and hopefully going to rise within a few days.
Beximco: Their bonus issue is increasing year after year. Their earning per share (EPS) is increasing compared to the previous years. The P/E ratio is very low. The net profit after tax has also increased in the last two quarters.
2nd Phase
Our loss from 1st investment is TK 136,590. To rectify this, in the 2nd phase, we sold off 10 of the stocks and bought up 6 new stocks after viewing favorable reasons. We have chosen 11 stocks from 9 different industry sectors.
Asset pairs with negative correlation always give excellent diversification benefit. This strategy helps to minimize risk while maximizing returns; so that, if one asset comes out as risky, then the other will be regarded as less risky than that. Or, if the price of a particular stock of a particular industry falls down on a day, then the price of the opposite type of stock of an industry will go up. Also we have used utility value to select stocks. Our risk aversion= 3, which means we are moderate risk taker.
The reasons behind buying these stocks in the second phase are:-
ACI Formulation (utility:-0.0117), which shows that lower utility scores provides a higher volatility and decreases the risk for a moderate investors as we are.
The Board of Directors of Asia Insurance (utility:-0.02305) has recommended cash dividend @ 25% and stock dividend @ 25% for the year 2010. Moreover the company has further informed that the subscription period for rights issue will be from 31.03.2011 to 25.04.2011. Record date for entitlement of rights share: 06.01.2011. The purpose of issuance of rights shares is to enhance financial strength and expansion of business of the company.We hoped that it will result in a tremendous scope as well as better performance, which has given us the reason to buy it.
The Board of Directors of Bank Asia (utility: -0.0043) has recommended stock dividend @ 40% for the year 2010. We bought the shares of this company to take advantage of this decision.
Board of Directors of the Bextex (utility: -0.00877) has purchased 35,00,000 shares of Tk. 100.00 each for an aggregate amount of Tk. 35.00 crore of Northern Power Solution Ltd. (NPSL) which represents 50% of the total shares of NPSL. NPSL has been awarded a 50 MW rental power plant project in Katakhali, Rajshahi by the Government of Bangladesh. So we purchased the stock thinking of the prospects for the company is good which can give us a good return.
As we know that bank sector is the most stable and reliable sector of all, so we decided to buy the stocks of UCBL bank (utility: -0.05097) in our portfolio. The Bank has informed that the Board of Directors of the Bank has decided to form a subsidiary company to establish a Merchant Bank subject to approval of Regulatory Authorities. So we purchased the stock thinking of the future prospects for the company. We sold off the Dutch Bangla bank’s share as it was not that much satisfactory according to our analysis calculation.
The reason behind choosing EHL (utility: -0.01996) : At the beginning of 2011 in January 9, The Dhaka Stock Exchange (DSE) suffered its steepest fall in its history as benchmark index of the Dhaka Stock Exchange, DSE General Index, slumped by 600 points.Though that day we buy the stocks in lower price but the conditions were worsen as the price was continuously decreasing. In March there was change in different positions, after which we have seen that the market price of EHL was again increasing at a considerable amount. Thus we expect a higher return in future so we have held the stock.
We sold off the BATBC’s stock because, according to a news release on ‘The Daily Star’ newspaper, we came to know that Anti-tobacco law is going to be toughened. The government is moving to amend the tobacco control act and introduce powerful pictorial warnings on cigarette packets and other tobacco items in a bid to reduce tobacco consumption drastically. The fine for smoking in public place will also be increased to 300tk from 50tk. So there are possibilities that smokers will cut off the daily consumption of cigarette packets. And hence, there is a chance that BATBC’s stock will not go well as the act will affect its share market as well. We even sold out the shares of Squarepharma, ACI limited, Samorita, Bata shoe, Green Delta Insurance, GP, IDLC, DBBL and Beximco mainly because of the negative or very low utility value
3rd Phase
In this phase, we sold off 9 stocks after evaluating the portfolio performance and bought up 9 new stocks. For the second portfolio’s stock selection, we have looked for the beta values. Also, we have calculated the treynor ratio for each stock which was our significant criteria in this phase. After obtaining the treynor ratio values, we have given higher weights to that stock which contains higher value treynor value, but we had constrain of market lot and tried to keep the investment in each stock within 10, 00,000tk.
Bextex has provided a lower return which was a reason to sell it. We bought BD Welding, National Bank LTD., Lanka Bangla, Agni Systems, Aramit LTD., Legacy Footwear, Daffodil Computers, Dutch Bangla Housing and Apex Food.
At the beginning of 2011 in January 9, The Dhaka Stock Exchange (DSE) suffered its steepest fall in its history as benchmark index of the Dhaka Stock Exchange, DSE General Index, slumped by 600 points. In March there was change in different positions that were holding the responsibility of managing DSE. During third Phase market become a little bit steady and we analyze further for getting better result from our investment. At this stage our beta for the individual stocks were at a better position like BD Welding, Lanka Bangla, NBL, Aramit LTD, Legacy Footwear, Apex foods, DBH and Bank Asia showed beta less than 1 but not less than 0, which means that it was a defensive investment with volatility of returns less than the market. EHL, Daffodil Computers and Agni systems had betas greater than 1 which means that investment in theses three stocks were aggressive with volatility of returns greater than the market. During the last two phases our Sharpe, Treynor, Information ratios and Jensen’s alpha were not in a good position which at this 3rd phase has been recovered by not getting any negative values in any ratios which we have faced earlier. Gradually our abilities and strategies improved and we made profit from increased diversification.
DIVERSIFICATION STRATEGY
Diversification is the main facts of our investment strategy and we tried to follow basic things to diversify our portfolio. Our first portfolio was based on our basic assumption without using any diversification tools we tried to diversify our portfolio, for example using P/E ratio, past return, Stock price, Category, Dividend yield and some other basic issues.
Second phase diversification was based on our analyzing, we analyzed our portfolio stock and find out their correlation with each other as well with the market itself. We tried to diversify by using negatively correlated stocks into our portfolio along with the positively correlated stocks. During our Investment period we faced a big problem and that is Market Crash results a very abnormal up and down of stock price. As the market was not in a normal position so our calculated correlation was not perfect we are predicting, but with our strategy we have diversified our portfolio in a standard way.
Major tools we used to diversify are Beta coefficient, Standard deviation, Sector wise investment, keeping systematic risk conforming with the return, going with the market return to a constant percentage level. And we were pretty much successful on that as our calculation suggest that our 1st portfolio beta was (.8826) and 2nd portfolio beta was (.8828) with standard deviation of (16.68%) and (19.93%).
At third phase we analyzed further and find out that stock with lower P/E ratio has a constant return rather than those with higher P/E ratio and their market correlation relatively at a consistent level. Also we tried to figure out stock consistency with their trade volume by applying moving average forecasting method. Hence market was relatively constant at this stage and we got a reliable result at third phase. We have got our third portfolio Beta (.6969) with a standard deviation of (21.64%). We can notice our standard deviation is increasing at every step it is because of return as return increase standard deviation also increase but the percentage of increasing was lower than the percentage of increasing the return.
[Note: As we know diversifying means keeping a constant return at certain risk level where portfolio will contain both positively and negatively correlated stocks. Due to market abnormality we couldn’t find out actual correlation among stocks. If the market holds a normal return we could diversify our portfolio more efficiently. ]
ECONOMIC RATIONALE FOR PICKING STOCKS
We choose our portfolio stocks considering a lot of factor after our first portfolio. At our first phase we choose stocks based on basic factor such as P/E ratio, past price record, stocks category, basically we tried to include strong fundamental stocks into our portfolio. Second phase selection time market was in the lowest level and we could pick stocks which have a greater gap but it also include a greater amount of risk. So we calculated expected return, standard deviation, utility using a risk aversion of =3, as though every stocks had a negative return due to market crash we choose stocks that was nearly to positive return and have a lower standard deviation. Based on high negative and low negative utility as well (every stock had a negative utility).Also we kept some stocks of our first portfolio to minimize our loss. At third phase we used stocks correlation with market also we considered trey-nor (T) ratio to select stocks, at this stage we also learned to consider favorable news of stocks which has a great impact on demand of a particular stocks and their price such as upcoming Dividend, quarterly financial statement, recent EPS, Projected P/E ratio, asset revaluation, right share issue or bonus issue and so on.
PORTFOLIO PERFORMANCE
Our total project was based on portfolio maintenance so most important part to us is portfolio performance rather individual stocks performance. Using specific stocks from various section of market we tried to create a smart diversified portfolio with a reasonable return.
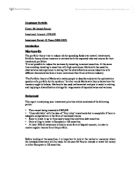
First Phase we select stocks without calculating correlation, expected return and others related issues to for selecting a stocks portfolio. Another big issue during the phase was big market collapse and every stocks price fall to a very lower point as well as the market index. We preferred Banking sector, Fuel & Power and Food & allied sector to others for our investment and choose strong shares from the market, but with the market collapse we lost a huge amount of our initial investment. And the loss was approximately 137,326 Tk. At this stage we decided to minimize our loss by keeping some of the stocks into our portfolio. Here is a snapshot of portfolio’s performance ratio-
Our portfolio standard deviation was 16.67% and beta was .8826 with return of -.9.80% and this performance is not expected to anyone.
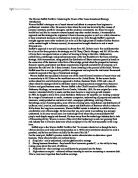
In second phase we calculated the expected return of the individual stocks and overall portfolio and compared it to the index expected return. The after tax profit was 4500 tk which is good compared to first phase profit moreover in this phase we regained our loss to certain percentage which we lost at first phase. Our calculated expected rate of return was -3.02% and the actual holding period return was 1.9%. The portfolio beta was .8228 after adjustment which is less than the market beta 1.We tried to keep our portfolio return to a certain percentage of market return and succeed to a percent but our expectation was not filled at this period. Here is performance measure ratio-
During third Phase Market become a little bit steady and we analyze further for getting better result from our investment, We used forecasting method using Moving average formula of forecasting, we tried to consult news related to stocks also we tried to find out some stocks through correlation and create a optimal mix of negative and positively correlated stocks and this stage our performance was pleasant to us and it was well diversified at this stage of market.
We bring out a profit of 76,095 tk with a expected return of -1.32% and Actual return was 5.43% for 3 month period, This stage our beta was a pleasant position and it was .6968 and it was reasonable also at this stage we reduce Portfolio firm specific risk to .11% that means our portfolio was diversified
For the first time we got a better and stable Sharpe, trey nor, and other ratio as well and we also get some deep insight of stock market about how the demand of a specific stock change how it affect its price.
RISK, RETURN, REGRESSION ANALYSIS
Portfolio presentation’s one of the elegant component is analyzing its return and risk. The risk and return during the last two three months of trading of our portfolios, are analyzed below-
Return- Last two three months trading of portfolios, Dhaka stock exchange has faced several unusual ups and downs in stock prices that it was hard to make profit. At first phase, we did not make profit, but in second and third phase, we make little profit. All the 3 phases we got negative returns. Though throughout the phases, we cannot have positive returns but we tried to maximize the returns over different strategies and maintain stability. The returns over our three phases are given below-
At phase 1 the expected return is greater than requited rate of return, that our investment was good enough compare to actual required return though we get negative holding period return. In the second and third phase we get positive holding period return that means if we hold the portfolio at the beginning period and sold it at the end of the period we will earn quite satisfactory returns.
Risk- Portfolio risk is measured by calculating Standard deviation of all the stocks and using those values, we calculated portfolio risk. Standard deviation shows how much the expected return can deviate from its average expected return. Beta of portfolio measures the exposure of the market wide or macroeconomic risk factors. It determines how much the market return will affect the portfolio return. If beta is more close to 1 then it will move more similarly with the market trend there is also firm specific risk which we tried to diversify as much we can. The overall risks of our portfolio throughout the three phases are analyzed below-
In compare to the 1st phase with 2nd phase our total risk increased but the systematic risk decreased. In our first phase the companies that have more than 1 beta was MTBL- 1.08, DBBL- 1.17, GreenDelta- 1.2, Navana CNG- 1.2, other stocks have less than 1. In phase 2, we have lowered the total risk and systematic risk. In the second phase, the companies with high beta were ACI formula- 1.0526, BEXTEX-1.0444, NAVANA CNG- 1.25. In phase 3 though the standard deviation increase but the systematic and firm specific risk decreased. In the third phase, we sold NAVANA CNG. In 3rd phase, we have AGNI SYSTEMS-1.23, DAFFODIL COMPUTER-1.23 with high beta. Overall, our portfolio beta was close to 1.
Regression- We had run the regression analysis, taking the daily return during the investment horizon, for each phase of portfolio and each individual stock and we have found following results.
1st Phase- The correlation of the portfolio with DSE index is .13, which is a positive correlation, which means the DSE index return has effect on the portfolio. The R-square is 1.8%, meaning the DSE excess return explains about 1.58% of the portfolio excess return. We can see the relationship of the portfolio excess return and DSE excess return in the excess return graph. The SS or sum of square is the variance of the portfolio, which is 0.00202 or .20%. MS for residual value tells us the variance of the unexplained portion of portfolio return, which is 0.0016. For individual stock high correlation was found in every stock except in Samorita.
2nd Phase- 2nd phase portfolio has correlation with DSE index of 0.09. It is lower than 2nd Portfolio. The R-square is 9.03%, meaning the DSE excess return explains about 9.03% of the portfolio excess return. We can see the relationship of the portfolio excess return and DSE excess return in the excess return graph. The SS is 0.12%. MS for residual value tells us the variance of the unexplained portion of portfolio return, which is 0.0015. For individual stock high correlation was found in AMCL, BEXTEX, DESCO, EHL, Navana CNG, ACI, and Titas Gas.
3rd Phase- 3rd phase portfolio has correlation with DSE index of 0.17. The R-square is 0.22%, meaning the DSE excess return explains about 3.06% of the portfolio excess return. We can see the relationship of the portfolio excess return and DSE excess return in the excess return graph. The SS is 0.004%. MS for residual value tells us the variance of the unexplained portion of portfolio return, which is 0.0014. For individual stock high correlation was found in Agnis systems, Daffodil computers, Apex food, DBH, EHL, Bank Asia, Aramit Ltd.
LESSONS LEARNED FROM TRADING
From the trading, we have gained practical knowledge on stock investment. This knowledge has given us confidence to trade in real life as well. We have learned few other points from the trading:
Portfolio return is influenced by the market news and trend. We can use our forecasting ability to know how an event will affect the market and portfolio return. For example if DSE now declares a new policy to restrict investment on risky stocks, we can predict, using specified tools, that how the market will react to the news.
During our 1st phase of the portfolio, we were in loss. It is because some unexpected events in DSE which effect in our portfolio. In the 2nd phase through our knowledge of investment theory we were able to earn profit. That means though market have effect on investment but through following proper strategy we can move on efficiently. Companies provide dividends of the respective year at the end of the year. Therefore, lot of expectation arises during the last quarter of the year. These expectations also influence the stock prices. Our investment was highly involved in the different sectors.
One should not always hear for the rumors which randomly spread. Most of the people do this but one should follow the market trend rather than go by the rumors. We must keep an eye on what’s happening and what fluctuations and news are coming out during the trading day; what are the turning points out there.
Only investing in the share business is very risky and should be avoided. One should diversify his investment in share market, bank investments, fixed deposits, government bonds etc. so that, if he loses the money in the market then he has at least some saving amount in his hand. We diversified our portfolio to reduce the risk. When entering the share business, we should look for the risks and profit as well. We have learned how the market works.
CONCLUSION
Initially we started with very little knowledge about investment and gradually we applied theoretical knowledge. We saw that we can earn profits while investing in a secured way by analyzing the stocks properly. It is also possible to maximize the profit using wise judgmental decisions with stock analysis. We hope that in future we will be able to use our knowledge from this report and become successful investors in the stock market.