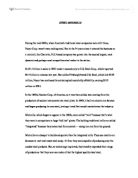
This project will involve ordering the large steel members from Eastern Europe, fasteners from The Far East, and welding materials and consumables from North America, and shipping these to the fabrication plant just outside of Georgetown Guyana. In the plant, the raw steel members will be fabricated to form the portal frame, and then partially assembled for inspection by The Employer (Guysuco) as a condition of the contract.
Once the building is complete and inspected, it will be transported across two rivers with no bridge access, which would require in country barging of the semi assembled structure. This project includes not only the portal frame but roof, decking and cladding as well. As a result of these factors the project network is more complex than usual jobs of this type.
Due to the above the board of ECI was concerned about the project schedule and timeline. As the plant was operating at capacity, the board required the latest start time of the project with a 95% chance of paying no liquidated damages. If the project was slated to go over time, they requested an analysis of the time cost relationships to find the most cost effective course of action.
BACKGROUND
Abridged History Of The Companies Involved
Engineering and Construction Inc. (ECI) was formed by a group of former colleagues, incorporated under the Companies Act Of Guyana on the nineteenth of May, nineteen ninety-eight.
A board composed of the founding directors manages the Company. Each member of the board is a shareholder, who is by default employed by the company. As a result, ECI is owned and operated by its key administrative and technical personnel. The board consists of engineering, accounting and upper echelon management of the corporation itself.
The work scope of ECI was defined to be structural steel fabrication, engineering consulting, construction and machinery equipment supplies.
Upon the foundation of the company, work was commenced on two operational locations. The machinery and equipment division was tasked with the sales of industrial and power generating units, inboard and outboard marine engines, as well as the Carrier air conditioning distributorship. This location, which also serves as a head office, is in Regent Street, Georgetown, the central business sector of Guyana. The other location, constructed in Friendship East Coast Demerara, is a nineteen thousand square foot manufacturing facility, which houses the structural steel fabrication and power unit assembly division. Both locations were completed in 1998 and are fully operational.
The basic modus operendi of ECI is “turnkey” service. The company maintains the organic expertise and ability to fabricate the structural steel, erect the building and complete the cladding and interior internally. They offer complete industrial, marine or commercial solutions, complete with engineering consulting, assembly and installation. ECI is able to design and install a custom job based on the particular needs of the customer.
From the inception of the company, the Guyana Sugar Corporation was the largest client. In 1976, the government of Guyana nationalized and merged the sugar estates operated by Booker Sugar Estates Limited and Jessels Holdings to form the Guyana Sugar Corporation, also known as Guysuco.
The corporation operates five sugar estates and eight factories, four in Demerara on both banks of the Demerara River in the area surrounding Georgetown and four in the east of the country on the banks of the Berbice and Corentyne Rivers. The geographic locations are better depicted in the map of estate locations (Diagram 1) below.
Diagram 1
The main business of Guysuco is the cultivation of sugar cane and the production of sugar. With sugar accounting for approximately 20% of the Gross Domestic Product and 40% of agricultural production of the country, the Guyana Sugar Corporation is the largest single contributor to the national economy.
The Guyana Sugar Corporation contributes significantly to the country's economy and society to such an extent that national economic fortunes are inextricably linked with that of the sugar industry. In year 2000, Guysuco net foreign exchange earnings reached US$88 million.
(Source Guysuco web page cp. 2002)
Rose Hall Estate
The Rose Hall Sugar Estate is located in the country of Berbice on the eastern bank of the Canje River. The largest structure in the estate is the sugar factory mill and boiling house building. In the mill chopped sugar cane is crushed to yield sugar rich juice. The juice is then purified and transferred to the boiler, where it is concentrated by evaporation, the first process in the manufacture of sugar crystals.
The current mill building is constructed of wood. Decay and pest infestation over three decades has prompted Guysuco to replace it with a steel structure. As a result a tender was conducted, leading to the contract which this project examines.
METHODOLOGY
PERT / CPM Method
Large projects present several difficulties for managers. These are complex to the extent that all the planning, scheduling and progress information cannot be seen nor tracked without tools and techniques to assist him or her.
In projects with numerous tasks, the program evaluation and review technique (PERT) along with the critical path method (CPM) can be used to plan, schedule and control by a manager.
This method is especially efficient in determining the critical path i.e. the progression of tasks from start to finish that will take the longest time. This succession is important to the manager as any delay in tasks along the critical path with delay the overall completion time. Non-critical tasks have slack, which is the amount of time that the activity can be delayed without affecting the overall project completion time. If any non critical activity is delayed beyond the slack, then it will become critical and delay the overall project.
The vast majority of PERT/CPM analysis are now done by computer, with specific software applications designed for project management, whereas this project is done manually to illustrate the processes involved.
It will follow these basic steps:
- Define the project and all of its significant activities
- Determine the precedence relationship between activities
- Estimate time needed to complete each activity
- Draw project network chart
- Compute longest time path (critical path) through the network
- Use the network for calculations to plan schedule and control the project.
In the project the significant tasks and their relationships are clearly defined, since they are physical activities determined by the project itself, following a simple chronological order.
In reality, no task has a definite time of completion, but we can compensate for this by obtaining optimistic, pessimistic and most likely times for each task. The information on expected times is contained in Table 1 which follows in the analysis.
In the manual method, the most important part of the process is the laying out of the information in graphical chart form. This not only provides an intuitive visual representation of the project, but is the basis for calculating all the characteristic values of the project. The chart for this project is designated Diagram 2 in the analysis.
The critical path determination and critical path calculation are in the analysis which follows.
Charting
Program evaluation and review technique (PERT) charts depict task, duration, and dependency information on a specific set of related tasks with a project. Each chart starts with an initiation node from which the first task, or tasks, originates. If multiple tasks begin at the same time, they are all started from the node or branch, or fork out from the starting point. Each task is represented by a table which states its activity designation, its duration as well as the latest and earliest start and finish times for that task.
Each task is connected to its successor tasks in this manner forming a network of nodes and connecting lines. The chart is complete when all final tasks come together at the “Finish” node.
Critical Path Method (CPM) charts are similar to PERT charts and are sometimes known as PERT/CPM. In a CPM chart, the critical path is indicated. A critical path consists of that set of dependent tasks (each dependent on the preceding one) which together take the longest time to complete. Tasks which fall on the critical path should be noted in some way, so that they may be given special attention.
ANALYSIS
Expected Times and Variances
Table 1 Key a – optimistic b – Pessimistic m – Most likely
Comments on Task Times
The tasks in Table 1 show a wide range of durations, specifically when looking at the difference between the optimistic, pessimistic and most probable times. Explanations are as follows
- Steel rollings in the Russian plant in Petroplast occur every forty five days. At present, the broker is consolidating our order and is confident that the items will be scheduled in the next rolling in mid April, giving the optimistic result. From experience, rollings usually run between one and two weeks behind, giving the most likely result. In the unlikely event the steel is not scheduled in this rolling, it will definitely make the next one, giving the pessimistic time.
- The welding supplies and consumables are ex stock at a warehouse near the Port Of Miami, and they will be transported by common carrier truck, giving small times and small variations.
- The fasteners (Guangzhou China) are a similar situation to A. Though they are close to the port, production runs are done every fortnight. Since the transportation time to the port is immediate and less than a day, the production and delivery were combined into one task. This order will miss the next run, and most likely the following one, giving the optimistic time. The third run is aimed for, with the following run being definite, producing the most likely and pessimistic times.
- Cladding must be barged to Antwerp. The times given were provided by the supplier.
- Steel is delivered by daily rail to Antwerp. However transit times vary widely and partial shipments sometimes occur. The times given here were provided by the supplier.
F, H & I, The shippers vessels leave at fixed intervals, so times were estimated using the knowledge that the items would most likely make the second ship departing after they have arrived, giving close values for the optimistic and most probable times. The pessimistic time is the next ship sailing. Please note that these times include voyage. The inland shipping the plant is also included since is less than on hour from the port and the company operates trucks, enabling immediate transport.
- The fasteners’ shipping is uncertain. The shipping line used (Odyssey) transships in Panama crosses the divide by rail and is reloaded. Another transshipment occurs in Miami, and then again in Trinidad. The resulting delays are frequent enough to justify the large difference between optimistic and pessimistic times, with the most likely time heavily favoring the pessimistic.
J K & R The fabrication and assembly / erection is subject to several circumstances force majeure, no sandblasting coating and assembly can be done in the rain. Irregularities in the steel and reject pieces cause errors only measurable in the finished work. The engineers at the plant were asks the times “as per experience” and their submitted values were used.
L, M, N, O, P & Q The sequence of events involving packing and mobilization were straightforward and accurate. These involve finite and predictable tasks that have no real variance.
PAGE LEFT BLANK FOR DIGRAM 1
PROJECT NETWORK
Activity Schedule
Table 2
Variability Analysis
Table 3
Cost Analysis
Table 6
FINDINGS AND RESULTS
Listing of Findings
Below are significant findings. Calculations can be found in the analysis section.
Significant Points on Findings:
- The expected time with 95% probability on time line refers to a requirement of the board. This, there is a ninety five percent chance that the project will be finished by this time (in this case three hundred and fourteen point two days).
- Total contract time is the time specified by the contract with the additional sixty day variation requested. As stated before this variation has not been formally approved, but this analysis assumes it will be.
-
The only items in the project that can be crashed are the fabrication and trial assembly. The ordering and shipping process is force majeure; the packing inland transport is short duration, low variation tasks limited by existing transportation infrastructure. Erection of the building must be done in conjunction with the factory management and equipment suppliers, so cannot be crashed.
Critical Path / Project Time Discussion
Please see reduced diagram of critical path below for discussion. Notice that, in the interest of space all figures have been rounded to the nearest whole number. The Full size diagram to one decimal place is located in analysis labeled Diagram 2.
Diagram 3
Possible critical path changes:
1. In the initial stages of the project, the most important characteristic in determining the critical path is the rolling time of the steel. Examination of the procurement and shipping phase illustrates the difference between the most likely and pessimistic times for A (The rolling of the steel members) is greater than the slack of G (shipping of fasteners). Further, the difference between the optimistic and most likely time for G is also great than the slack of G. As a result, there is a possibility that C→G→K will replace A→E→I→J→K as the critical path.
This is significant since, if this occurs, crashing the fabrication would make no difference on the total project time. The trial assembly has a maximum crash reduction of 7.4 days, which will not make up the deficit.
2. The only decimal places kept on the simplified diagram above are the slack calculations for L (packing for inland transport) and O. (first overland transport.). This was done to avoid confusion in the critical path examination. However, it is worth mentioning that the slack values for L and O are extremely small, being a matter of hours. This is not particularly significant since the task times and variances for the transportation / mobilization and erection are both small, showing that this alteration to the critical path would have minimal effects on the overall project time.
RECOMMENDATIONS
- Monitor production and shipping of steel members and fasters, in order to adjust plant schedule and apply for additional time:
The primary drivers of the total project time is the rolling and shipping of the steel members. However, as mentioned in the findings section, the variance in the delivery and shipping of fasteners may cause this to become critical if there are improvements in steel members’ overall delivery time or delays in the fastener overall delivery time.
Even though the contract has no control over these tasks, it is recommended the project manager follow the progress of these deliveries carefully.
Early deliveries may mean that the plant must tool and jog earlier than projected with the benefit of reducing the liquidated damages. In this case the plant schedule would have to be adjusted and an investigation done to see if the reduction in liquidated damages would justify crashing or delaying other current jobs.
Late deliveries would give the plant additional time to prepare, and enable the reduction of overtime (and cost) on existing jobs. Additionally, time variations can be claimed from the employer based on the force majeure clause of the contract, as delays in shipping due to unforeseen circumstances are completely beyond the contractor’s control. From experience with Guysuco, variation claims are usually granted once they can be substantiated in writing by the manufacturer or shipping company, and are made well in advance.
2. Accept liquidated damage rather than crashing:
The lowest crashing cost per day is K (trial assembly) at approximately eighty two thousand, five hundred dollars. This is more than double the cost per day of liquidated damages (approximately forty-one thousand dollars.)
Further, this daily rate is only applicable for a maximum reduction of seven point four days. If more than this is required, the fabrication cost per day of crashing is approximately one hundred and twenty eight thousand dollars.
As a result, it is recommended that no crashing be done, and that liquidated damages be accepted as the least expensive alternative of any case where the project will not be finished on time. To put this in perspective, as shown in the analysis, there is greater than fifty percent probability that the project will finish on time and greater than ninety-five percent probabilities than the liquidated damages will not exceed one million dollars.
3. Request additional time based on bid validity
The original bid validity was one hundred and twenty days, meaning that the tender submitted was not valid past four months from the date of the tender. The initial award in September 2002 was within the validity period, but the subsequent delay and final contract signing in January 2003 was beyond.
As per contract, a petition should be made stating that the delays in the final award caused supplier agreements to expire, which lost placements in raw materials manufacturer scheduling. Resultantly, the orders were removed from the queue, causing delay times which pushed the estimated completion time beyond the contract completion requirement. Though this recommendation is unrelated to the analysis put forward here, it is nonetheless valid and would reduce any liquidated damages.
BIBLIOGRAPHY
-
Introduction to Management Science, Anderson, Sweeney, Williams, Tenth Edition 2003
-
CAM 384: Introduction to Management Science, Jeffers, http://www.rice.edu /384Lecture 2002
-
Guyana Sugar Corporation Corporate Web,
-
Introduction to Management Science, Taylor, Seventh Edition 2002
-
PERT Prioritizing, Nehal, http://www.msu.edu/~Nehal /PERTCPMNSR
Student # 2002625564 CM778 QBA Individual Project