a. Strengths:
i. Presence in diverse geographical locations like Europe and middle-east.
ii. Continued presence in emerging markets such as India, with the acquisition of Hutch.
iii. Entering Uk’s iphone market and challenging price with competitors.
iv. Expanding into US market with the takeover of Verizon wireless, which uses
CDMA technology.
b. Weakness:
- Lack of concentration on the need of customers. Nearly 1 million students come to Uk from other countries for higher education. The charge for an international call in Vodafone is high when compared to its competitors, which drives the customer to shift to other network provider.
- Business in US is not so strong when compared to Europe or rest of the world.
- Less exposure to emerging technologies.
c. Opportunities:
- To focus on cost reductions.
- Expand global presence.
- When stable economic conditions return, the flexible services that the company provide such as email and internet access will support more sustainable growth.
- Research and Development on technologies like 3G and Wi-Fi, Palm pre.
-
Concentration on age-groups, such as every 3 in 5 teenagers in UK, use mobile.
d. Threats:
- Volatile financial markets.
- Rival O2, is to unveil palm Pre.
- Highly competitive market, with competitors like Orange and O2.
- Entry of new competitors into the market.
- The potential growth of new mobile customers has decreased and should adjust resources efficiently.
- Not meeting the expectations of the customers such as loss of call clarity, network jam and call rate.
- Far behind local mobile network operators in local areas such as Airtel in India.
- Restrictions on cross border cell phone usage.
7. Annual Report
According to Holmes, Sugden and Gee (2008, pp. 110), an Annual Report is a corporate document which gives numerical and narrative description of a particular company. The important components of the Annual report are the director’s report, business review, annual accounts, remuneration report and corporate governance report whereas the chairman and chief executive reports are not mandatory. The annual accounts include balance sheet, profit and loss account, cash flow statement, equity statement and notes related these accounts.
The chairman of Vodafone group Plc, Mr Sir John Bond, in his report, released on 19th May, 2009, for the year ended 31 March 2009,incorporating company’s operations for the fiscal year 2008-09, stated that the company had delivered the adjusted operating profit of 11.8 billion and free cash flow of 5.7 billion, in a friendly foreign exchange conditions. The company followed IFRS standards for its consolidated financial statements and in accordance with company act 1985 in IAS regulation. Revenue for the year 2009 has increased by 15.6%, whereas the group data revenue has increased by 43.7%. There has been a considerable increase in the revenues in other segments. The company is recommending a total dividend of 7.77 pence whereas the share value has declined by 17% in the year which shows its positive attitude towards its shareholders. He accepted the impact of economic slowdown in telecommunication market and stated that the company had made a change in the board and their strategy, and believes that this would help them to get through the economic recession.
On a whole, the tax and impairment loss for the year 2008 was very high where as the adjusted EPS increased by 34.4% due to favourable foreign exchange. Section 50 to 54 of Financial Act 2004 supports the effective tax was lower than the groups weighted tax due to the structural benefit of ongoing enhancement.
Recently, Vodafone appointed two non executive board members, announced the completion of merge with Vodafone Australia limited and Hutchison 3G Australia pty limited and united with telecommunication giants in Greece and Azerbaijan. Vodafone, in its half year financial report ended September 2009, achieved a revenue of 21.9 Billion, with an increase of 9.3% and an operating profit of 5.9 billion which accounts to an increase of 2.4%.
Ratio Analysis – Company’s performance
Stead (1995, pp.134-136) states that Financial statements provide valuable information to its owners, investors, analysts and banking officials. The key areas of their interests are company’s performance, financial status and investments.
Ratio analysis is a widely used tool for analysis of financial statements of a company to compare itself with the competitors, and the company itself over a period of time or history. Ratios give the relationship between different items in the financial statements. If the management is not satisfied with the company’s financial performance, the management can identify irregularities and anomalies which need further investigation or enhancement with the use of ratio analysis. Ratio analysis also helps in budget forecasting, analysing the liquidity and evaluating financial position of the company.
Barry Elliott and Jamie Elliott (2008, pp. 668-675) states that the important and most frequently used ratios which help in analysing a company’s performance are as follows: (figures used are from company’s annual report).
Margins:
Gross operating Margin: Gross operating margin as a percentage is the ratio of difference of sales and cost of sales to the sales of the company.
Gross operating margin = (sales - cost of sales) / sales
= (41017 – 25842)/41017 = 36.99%.
Profit Margin (Primary efficiency ratio): Profit margin as a percentage is the ratio of company’s profit before tax and interest to the sales of the company.
Profit margin is the widely used ratio to analyse the company performance. It depends on the industry the company is operating, its pricing policies, sales volume and cost structure.
Profit margin = operating profit before tax and interest /sales.
= 4189/41017 =10.21%.
According to Holmes (2008, pp. 122-125), the management sets low margins to increase market share or can be caused by expansion costs. But in general, low margins suggest poor performance of the company. Unless there are no barriers like patents and high initial capital costs, Vodafone with its margin have the capability to attract competition, with its profit margin.
Net Profit Margin: Net profit margin as a percentage is the ratio of company’s profit after tax and interest to the sales of the company.
Net profit margin = profit after tax and interest /sales.
= 3080/41017 = 7.51%.
Operating ratios:
Return on Equity (ROE): Return on Equity as a percentage is the ratio of company’s net profit (profit after tax and interest) to the equity, excluding outstanding shares. Return on equity measures the return on the customer’s investments.
Return on Equity (ROE) = net profit after tax / Equity.
= 3080/ (84777-4153) = 3.8%.
Return on Assets (ROA): Return on Assets as a percentage is the ratio of company’s net profit before tax and interest to the total assets of the company. ROA measures the amount earned on each unit invested in a company.
Return on Assets (ROA) = net profit before tax and interest /total assets.
Return on capital Invested (ROI): Return on capital Invested as a percentage is the ratio of company’s net income to the sum of long term debts and equity, excluding outstanding shares.
ROI = net profit / ((long term debts + equity) – outstanding shares).
= 3080/ (31749+84777-4153) = 2.7%.
Return on capital employed (Primary Operating Ratio) (ROCE): Return on capital employed as a percentage can be expressed as a ratio of operating profit before interest and tax to the capital employed.
ROCE is the fundamental measure of company’s profitability. It expresses the efficiency of the management as it contrasts the net profit with the fixed and current assets which are under management control.
Return on capital employed = net profit (before interest and tax)/capital employed.
= 4189/152699 = 38%.
Efficiency ratios:
Asset turnover (Primary utilisation ratio): Primary utilisation ratio can be expressed as the ratio of revenue to the capital employed.
The ratio is the measure of how much sales is generated by the capital asset base.
Asset turnover = turnover (Revenue) / capital employed.
= 41017/152699 = 0.3.
Liquidity ratios:
Current ratio (Primary liquidity ratio): Current ratio can be expressed as the ratio of current assets to current liabilities.
Current ratio is the indicator of company’s short term financial position. Now-a-days, a figure of 1.5 is usually seen.
Current ratio = current assets/current liabilities = 13029/27947 = 0.47.
Quick or Acid Test ratio: Acid test ratio can be expressed as the ratio of difference of current assets and stock to the current liabilities.
This ratio recognises the company’s financial strength if the company is able to settle down creditors straight away.
Quick or Acid Test ratio = (current assets – stock) / current liabilities.
Leverage ratio: is defined as the ratio of the company’s total assets to its net assets.
Leverage ratio = total assets / net assets.
Total debt to Equity ratio: is defined as the ratio of total debt to the equity.
Earnings per Share (EPS): Earnings per Share can be expressed as the ratio of net profit after tax to the number of shares outstanding.
EPS is a key measure of a company’s profitability, growth and the company’s ability to pay dividends.
Earnings per Share (EPS) = Profit attributable to ordinary shareholders/weighted average number of outstanding shares during the period.
Valuation ratios:
Price Earnings ratio (PER): Price earnings ratio can be defined as the ratio of market price per ordinary share to the basic earnings per share.
Generally, the ratio of previous days’ market price of the share to the basic earnings per share.
Price Earnings ratio (PER) = market price per ordinary share / basic earnings per share.
Price per Sales ratio (P/S): Price per sales can be defined as the ratio of the market price of the share to the company's sales per share over the last 12 months.
Price/Cash flow ratio: Price to cash flow ratio is defined as the ratio of recent market price of the share to the cash flow per share over the last 12 months. This ratio measures the ability of the business to generate cash and is a measure of liquidity.
Dividend yield: Dividend yield as a percentage is the ratio of the stock’s most recent worth to the current market price.
Some of the important ratios are calculate based on the company’s annual reports and tabled below.
Economic downturn has an adverse effect on Vodafone. The gross profit margin, a measure of company’s profitability, and return on equity has shown a downward trend. This is because of decrease in the operating profit from 5857 million to 10047 million when compared to the year ended 2008, as a result of increased share in undertakings, increase in income tax, cost of sales and impairment losses in 2009. The investments in associate undertakings have increased from 22,545 million to 34,715.
There is a slight difference in the current ratio, acid (quick) ratio, financial leverage ratio, debt/equity ratio and asset turnover ratio with the year 2008.The long term debt has been increased from 22662 million to 31749 in 2009 and the equity has increased because of increase in capital redemption reserve.
There has been a considerable growth in the revenue year after year and the growth rose to 15.6%. Price per earnings ratio has shown a considerable increase in 2009, while price to book, price to sales and price to cash flow has a slight decrease when compared to the previous year. There has been a decrease in basic earnings per share from 12.56 pence in 2008 to 5.84 pence in 2009 whereas the cash dividend, amount paid for ordinary share has increased to 7.77 pence from 7.51 pence.
Pyramid of key ratios:
The increase in the ROCE for the year 2007-08 is driven by the increase in operating profit, this is because of decrease in impairment losses, where as ROCE decreased for the year 2009, with the increase in impairment losses (goodwill). The company has increased its cash equivalents in balance sheet by 150% (4878 from 1699) in the year 2009. This helps the company to buy back its shares or for further expansion.
The current liabilities are higher than current assets and are resulting in net liabilities. This can be explained by the current ratio. There is a need for attention on the current ratio if the decrease in the current ratio is a deliberate policy. Fig (1) states the relationship between various ratios.
Recent Performance and developments
In May 2006, Vodafone set a 5 point strategy of revenue simulation and cost reduction in Europe, market growth, managing functions for maximum returns, capital structure and share holders returns and total communications. In one or the other way, in spite of the adverse market conditions, the company managed to achieve its adjusted targets.
The company managed a group revenue of 33.3 billion with an increase of 14.1% over the previous year. The operating profit increased by 5.7% to 10.1 billion and the free cash flow of 5.5 billion. At the end of fiscal year 2008, the company had a customer base of 260 million. The total dividends of the share were increased by 11.1% to 7.51 pence, with a final dividend per share value of 5.02 pence.
Due to economic downturn, the company revised its strategy in Nov 2008, with the objectives of driving operational performance, pursuing growth opportunities and executing in emerging markets. The company has accelerated 1 billion cost reduction programme that would save 200 million, which can be used for restructuring charges. In Nov 2008, the company established Vodafone roaming services business unit.
This has been achieved through the cost reduction initiative and focussing on innovative tariff packages, strategic marketing-with the use of inexpensive Voodoo concept and offering promotions for improving customer lifetime. The voice usage has been increased by 16.7% and there is a comprehensive increase in text and picture messages sent. On a whole, the cost reduction initiative had saved a cumulative sum of 550 million.
The emerged markets such as Vodafone Essar in India performed well. Since acquisition, there are 1.5 million customer additions with a revenue increase of 50% over the year. The company exported 7 million low cost handsets, as little as 20$, to India to avoid dependency. The company strengthened its total communications with the purchase of Tele2’s assets in Spain and Italy.
On 10th November, 2009, Vodafone has released its half yearly financial report for the month ending 30th September 2009. Group revenue rose by 9.3% to 21 billion pounds, with a benefit of 4 % from foreign exchange.
Group Revenue:
Service Revenue:
In 2009, the company’s data revenue grew by 25.9% and is now over 3 billion. Group revenue increased by15.6% to 41 billion with an adjusted profit of 11.8 billion with an increase of 16.7%. In Feb 2009, Vodafone merged with Hutchison 3G Australia and will operate jointly under Vodafone brand. This proposal will generate a revenue of 2billion AUS$ to Vodafone and will release 0.5 AUS$ to Vodafone through deferred payment.
Competitive Analysis:
Vodafone faces a tough competition in the telecommunication market from its competitors like Duetche telekom and Telefonica-O2. With the release of palm-pre into markets, Telefonica-O2 has expressed its innovative capability in telecom services. Telefonica financial reports incorporates company’s operations from January to December of every year. The company used IFRS standards for its consolidated financial statements. The comparison between Vodafone and O2 can be best analysed by comparing their financial ratios over a period of years. The report gives the data of progress and activities for the year ended December 31, 2008.
Vodafone Plc. Telefonica-O2.
Operating return on Equity:
2006-07 (1564)/67293 = 2.3%, Dec 2006 6764/20001 = 33.8%
2007-08 10047/76471 = 13.1%, Dec 2007 10684/22855 = 46.7%
2008-09 5857/84777 = 6.9%, Dec 2008 10915/19562 = 55.7%
Financial Leverage multiplier:
2006-07 109617/67293 = 1.62 times Dec 2006 108982/20001 = 5.45 times
2007-08 127270/76471 = 1.66 times Dec 2007 105873/22855 = 4.63 times
2008-09 152699/84777 = 1.8 times Dec 2008 99896/19562 = 5.10 times
ROCE:
2006-07 (1564)/109617 = 2.1% , Dec 2006 6764/108982 = 6.2%
2007-08 10047/127270 = 7.1%, Dec 2007 10684/105873 = 10.05%
2008-09 5857/152699 = 2.7%, Dec 2008 10915/99896 =11%
Asset turnover:
2006-07 31104/109617 = 0.28 times, Dec 2006 52901/108982 = 0.48 times
2007-08 35478/127270 = 0.27 times, Dec 2007 56441/105873 = 0.53 times
2008-09 41017/152699 = 0.26 times, Dec 2008 57946/99896 = 0.58 times
Operating profit margin:
2006-07 (1564)/31104 = 5.02% Dec 2006 6764/52901 = 12.7%
2007-08 10047/35478 = 28.3% Dec 2007 10684/56441 = 18.9%
2008-09 5857/41017 = 14.2% Dec 2008 10915/57946 = 18.8%
Current ratio:
2006-07 12813/18916 = 0.68, Dec 2006 17713/26337 = 0.67
2007-08 8724/21973 = 0.40, Dec 2007 18478/24974 = 0.73
2008-09 13029/27947 = 0.47, Dec 2008 17973/25132 = 0.71
Acid test:
2006-07 (12813-288)/18916 = 0.66, Dec 2006 (17713-1012)/26337 = 0.63
2007-08 (8724-417)/21973 = 0.38, Dec 2007 (18478-987)/24974 = 0.70
2008-09 (13029-412)/27947 = 0.45, Dec 2008 (17973-1188)/25132 = 0.68
Gearing ratio:
2006-07 17798/67293 = 0.26, Dec 2006 50675/20001 = 2.53
2007-08 22662/76471 = 0.30, Dec 2007 46942/22855 = 2.05
2008-09 31749/82777 = 0.37, Dec 2008 45088/19562 = 2.3
Creditor’s turnover:
2007-08 22662/35478 = 233 days Dec 2007 46942/56441 = 303 days
2008-09 31749/41017 = 282 days Dec 2008 45088/57946 = 284 days
Debtor’s turnover:
2007-08 6551/35478 = 67 days Dec 2007 9662/56441 = 62 days
2008-09 7662/41017 = 68 days Dec 2008 9315/57946 = 59 days
From the ratios calculated above, it can be inferred that Telefonica had a much higher ROCE and is rising, whereas Vodafone’s ROCE has increase during 2008 because of an increase in operating profit. The operating profit margin has increased drastically during 2008 for Vodafone as there was no impairment losses put forward in the financial report, whereas in 2009 it rose to 5900 million. There has been a consistent growth in Telefonica’s operating profit since 2006.
The debtor’s turnover period had slightly changed over the last year. Even the turnover period for Vodafone is not acceptable, whereas the turnover period for O2 had slightly decreased. The creditor’s turnover period has increased for Vodafone in 2009, which gives some more time for Vodafone to pay the creditors.
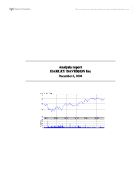
The fig (2) below shows the fluctuation in the share prices of Vodafone and Telefonica since may 2006. The lower part expresses the daily change.
fig (2): Graph of Vodafone and Telefonica share price.
On a whole, Telefonica benefits from high asset turnover, high margins and effective utilization of working capital whereas Vodafone have low asset turnover, slightly bit lower margins and maintains high working capital in debtors. The gearing ratio is stable when compared to O2. According to Chopping, Carroll and Skerratt (1999/2000) pp.100), it is difficult to compare the companies based on segments as the companies may allot differently for different segments.
Conclusion and Recommendations
Vodafone, facing tough situation today, was one of the world’s leading telecommunications giant. Its slump has come from its takeovers. The company should really consider the need of the customers using customer surveys. The company should concentrate on students, who contribute over 60% of the UK population. It should expand its supremacy in United States by introducing some promotional offers with cheap calling rates. Though it earned losses, it paid the dividend to the shareholders, valuing the stakeholders. It should continue doing so. At the end of the day, stakeholders are the pillars of the business. It should keep an eye before it bid for a takeover as it sometimes necessary to maintain the liquidity.
Bibliography
-
Chopping, D and Carroll, R and Skerratt, R., (1999/2000). Applying GAAP, ICAEW, p.100.
-
Elliott, B and Elliott, E., 2008. Financial Accounting and Reporting, Twelfth edition. Spain, UK: Prentice Hall International Ltd, pp. 668-675.
-
Holmes, G and Sugden, A and Gee, P.,2008. Interpreting Company Reports and Accounts, Tenth edition. Spain, UK: Prentice Hall International Ltd.
- Sections 50-54, under the heading of Accounting Practice, and Schedule 10 (Amendment of enactments that operate by reference to accounting practice), Financial Act 2004.
-
Stead, M., 1995. How to Use Company Accounts for Successful Investment Decisions, FT Pitman Publication, pp.134-136.
-
‘Performance at a Glance’ Available at: Accessed on 8 December.
-
‘Share Price’ Available at: Accessed on 10 December.
-
Telefonica- O2, 2008, Annual report – 2008-09 (Online) Available at: Accessed on 10 December.
-
Vodafone, 2008, Annual report – 2008-09 (Online) Available at: Accessed on 14 December.