Examinations
Dominance of verbal abilities for girls and the increase of written tasks in tests since the National Curriculum, has emphasised the differences that were already present, between boys and girls. Gipps and Murphy (1994) identified that boys tend to have poor organisational skills, which may disadvantage them in coursework and long-term projects, so teachers need to provide strategies that develop this skill in the classroom.
Studying the local and national statistics I could summarise the following: (National Statistics, www)
- In Wales, there has been concurrent findings when comparing the 1992-1998 brief to the current 2000 report. Girls in general, continue to perform better than boys, with smaller gaps in maths and science than in languages.
-
Key Stage 3 maths and science are the only areas where the Assembly’s targets for reducing the gap are being, or have been met. It is also apparent that boys generally do considerably better at tests than in teacher assessments.(See appendix).
- At Key Stage 4, the gap between boys and girls has increased since 1996.
- At A level, the gap is greater than in 1996, but decreased between 1999 and 2000.
Analysing the Dfee 2000 summary of results there was a repeated pattern. The results in Maths and Science are more favourable for girls in England but the gap is quite small. Gender neutral and more masculine subjects such as Physical Education and Business Studies also demonstrates a smaller gender gap.
The Welsh National Assembly has set targets to reduce the gender gap, in Welsh schools, by 50% for the core subjects, English, Maths, Science and Welsh. The current review indicates that it would be a struggle for English to meet this target by 2002. Looking at the long term results, the gaps are quite constant, so it is questionable whether the target is too optimistic. Overall, the improvement in grades for both genders is positive and schools need to be cautious in applying knee-jerk methods to meet targets. In the school that I have observed, they have tried boys only English classes to improve results of borderline C boys in Y10. The class emphasises stereotypical topics, such as blood and gore, to try and interest them in developing their verbal skills. The teacher of the class has commented about the group being more disruptive since ‘girls tend to have a calming effect on boys’. The reasoning for a boys only class is to be more specific in applying suitable teaching styles to suit them. This stems from the hierarchy of learning styles and it is proposed as follows, (Riding, 1991)
- Descriptive
- Reflective
- Speculative
It expressed that boys have a trial and error, experimental learning style rooted in confidence, competence and an interest in the manipulation of objects and systems. Boys are considered to be speculative thinkers. Girls are said to have a more language centred, sequential learning style rooted in an interest in people and relationships. Girls are considered to be reflective thinkers. Most boys are on the bottom rung and teaching strategies could be used to encourage reflective and descriptive thinking. It is just as important for girls since they also need to improve their lingual abilities. However the change of speculative to reflective thinking can be quite difficult and since there are more boys at this early stage of lingual development then it is viewed necessary to have a boys only class.
Kruse has found that ‘girls underrate themselves compared to boys of the same intellectual level’ (Kruse, 1992, 85). It would be interesting to explore this further. Even though girls underestimate themselves, teachers are assessing them higher results than expected. By doing so more demands are placed to meet these results (as in target setting). There may be parental influence or self-motivation to meet them. On the contrary, boys are assessed with lower targets and there is less intellectual pressure to meet their targets since the target is too easy. In a study by Harris et. al.(1993), teachers reported that girls are aware of and will conform to the conventions: careful presentation, openness in social interactions and willingness to remain on task. This strategy used by Y10 and 11 girls tends to occur with middle ability students and at that stage masks a particular set of long-term needs. There is a lot of speculation about why boys perform differently but in examining all the data I realise that this is too much of a complex issue and unresolved issue to pin-point any specific reason why boy’s behave as such. Perhaps understanding why there are gender differences in attitude, teachers can be more aware of what to do. However, this may lead to gender inequalities and I think it is more important to try and be more gender neutral in teaching both sexes equally. The inherent nature of boys to be less willing to comply to the accepted conventions, may lead to a lower teacher assessment, which is seen in the statistics for KS3, (Gipps and Murphy 1996). In science, KS3 assessments are usually based on end of module/term tests, which is a long term strategy to assess grading. Boys are reported to be less able to perceive long term goals. If girls are consistently performing well throughout KS3 then the assessment would lead to higher grading compared to their intellectually equivalent counterparts. Is this fair? Should girls be treated as more intelligent when they are not just because they behave appropriately and hand in work on time. How is this dealt with in schools? Although teachers say that they spend equal time between the genders observations made by Riddell (1992) find that boys occupy more of the teachers time because of misbehaviour and attention seeking. My observations at school reinforces that, but I do not think that girls are innocent and they are just as likely to be off task, but draw less attention to themselves compared with boys who try and push the boundaries (Warrington and Younger 2000).
Girls traditionally, were less likely to take science and would take the more traditional female studies such as music and arts. Presently, girls are still more likely to take these stereotypical roles, which do not reflect their ability and grading. The sciences are often viewed as too difficult and girls are less likely to challenge themselves in this area (Warrington and Younger 2000). Even when the choice has been made to take science many studies show that Biology tends to be more subscribed by females and Physics and Chemistry dominated by males (Harding, 1996). It is unfortunate but logical, to do what you are good at and use it to follow a desired career. Science a traditionally male subject, has a contrasting emphasis to English which is stereotypically female. It is important that pupils are promoted to match their potential and are given the knowledge and skills to have a variety of choice.
Girls can often feel annoyed when faced with over dominant boys in practical sessions (TES 12/01/01). In science, boys were commented to be achieving success at the expense of girls. In some aspects, science is suited to boys because it targets their non-verbal and quantitative abilities and is speculative in nature. This is in line with men being more able at science and therefore more likely to take sciences at university and hence statistically more likely to have a career in this field. It is imperative to develop a positive view of science for girls because they need to realise that there are career opportunities for women in science. However, the overwhelming numbers of men in the profession, as described by the GIST project (Girls into Science and Technology) revealed how school science has become masculinised. The Department Of Trade And Industry are concerned with the lack of women taking traditionally male careers in engineering, chemistry and physics and are trying to raise the profile of science at school by helping to launch a teen-magazine focused on careers in these areas.
School Study
Study of Y7 Cognitive Ability Test (CAT) Scores (Appendix 1)
Most secondary schools are using CAT to analyse their intake pupils for potential and performance. It can also be used as a tool for analysing pupils learning styles and applying cognitive research to real data. Each school has data returned from the tests and they can be analysed graphically. If unfamiliar with CAT tests, they are divided into three sections which test verbal, quantitative and non-verbal reasoning ability.
In order to understand the results we need to know the background of the school and their intake. The school has a growing intake and their NOR is steadily reaching 1,200. In the past, the school did have a sixth-form but that has gradually been phased out because the Local Education Authority is developing the role of the local college as the specialist location for post-16 studies. It’s main competitor for pupils’ is the local Welsh-speaking school. The catchment of pupils’ for the Welsh-speaking school tends to have a stronger academic intake. The poor socio-economic background of the school means that pupil’s may be poorly motivated due to parent’s low aspirations. The school boasts value added grades (pupils gain higher grades than predicted by their grades at entry to the school). Using a school’s Y7 CAT scores I intend to identify any gender differences at this stage from KS2 to KS3 education.
The CAT measures ability in:
- verbal reasoning - with words and word structures and using words in context;
- quantitative reasoning - with numbers and symbols, which can indicate potential in science and mathematics;
- non-verbal reasoning - with geometric or spatial elements, without verbal influences.
Scores mainly range from 65-130. Under 65 the results are unreliable because of insufficient data. Statistically, most pupils are around 100 and a higher score indicates above average ability/intelligence. The mean scores of the year group are as follows:
The results rely on accurate answering by pupils on the lottery style form. Some pupil’s may be poorly represented by the test if English is not their first language, have difficulty understanding how to answer the questions or find it difficult to mark neatly in the spaces. These may all lead to inaccuracies when the form is marked by a machine.
When the mean scores of females and males are compared both sexes have a close aggregate score (94.93 & 94.91 respectively). The verbal score of the girls is slightly higher than the boys. The quantitative reasoning is higher with boys which is concurrent to the studies as discussed earlier whereas the Non-verbal reasoning is similar but girls have a slight advantage. Overall GCSE grades can be predicted (from a catalogue of previous results comparing mean scores)
Between 95-104 is the mean score, which could be designated the ‘norm’ for the year and could be predicted a GSCE C/D. This mean score depends highly on the intake that year and may vary from school to school. This may be used by the LEA to set school targets by comparing results to the National Percentile Rank (NPR) or LEA ranking. Using the distributions a score of 100 is set as the normal and the range of 95-105 is statistically where most pupils are at in the UK. It is noted that the non-verbal range has been adjusted accordingly to 90-99 to meet national norms.
The test allows a comprehensive analysis of the results. It can show the number of attempts a candidate has made and their score for each reasoning skill. Each of these sections could be divided further to allow deeper analysis. For example:
Verbal Reasoning, V
V1 – Understanding words as a concept. Descriptive.
V2 – Understanding the concept of a sentence. Communication. (A low V2 score would indicate difficulty with reading
V3 – Classifying words into families (Functionally not very useful)
V4 – Identifying opposite words (Antonyms)
Quantitative Reasoning, Q
Q1 – Understanding the concept of quantity.
Q2 – Spotting patterns in numbers i.e. series.
Q3 – Algebraic Processes, understanding signs and symbols.
Note: Q1 needs to match Q2 for the latter to be understood, which would demonstrate mathematical ability. Deficiencies in this area of reasoning may lead to deficiencies in Maths, Science, Geography and any other subject, which requires the concept of quantity in the use of numbers. It has been found that Q2 is consistently higher than Q1 in this school and across the UK. The use of number lines in the KS2 curriculum of study is used to improved this.
These analyses could be provided to Head of Faculties to aid setting and to guide teachers about the groups developmental needs and also cater for each individual.
If we compare the standard deviations we see that the school has a narrow deviation at 11.5 from the mean (The average for the UK is 15). Comparatively if a school had a broad deviation then there are more pupil’s in the middle ability range and can support the fewer lower ability and higher ability pupils. In this scenario mixed ability teaching can be beneficial. Since the school has a narrow deviation from a relatively low mean there are less of the higher able pupils in the year group and the ability range is quite clustered. This has implications in teaching mixed ability so the school chooses ability setting. Now, comparing the standard deviation of boys and girls, taking into account each reasoning ability, the girls tend to be quite consistent but a very low deviation exists. The boys have a different profile and it is quite noticeable that quantitative reasoning is broad at 14%, compared to overall results of the sexes. The overall distribution of boys and girls are similar but investigating further we find there is greater numerical ability predominant in boys and higher verbal reasoning in girls. Already a pattern is seen that correlates to the summarised findings by Gipps and Murphy (1993).
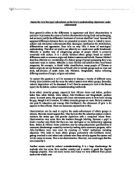
Looking at the histograms each ability could be analysed. Firstly verbal reasoning is considered.
Instantly, it is shown that there is a broad deviation for boys with a few boys scoring at the higher range, outperforming many girls but also there are many at the lower range scoring 65-69. The range of 85-89 is deemed the critical point because below that the pupil’s would be most likely to suffer academically since verbal reasoning is most commonly used to assess learning. The school has a dyslexia unit, where all severe dyslexic pupils in the LEA are offered a place. These are mainly boys and it would be likely that these pupils are under the critical point to various extents. It is necessary to clarify that although a child may have low verbal reasoning skills it does not suggest that they are not intelligent. It is very difficult to test non-verbal reasoning skills since most subjects require some sort of written test to demonstrate understanding.
The quantitative histogram supports the findings using the standard deviation showing a broad distribution with boys scores spread out and girls narrow. Additionally it reinforces the fact that the boys have on average a higher score than girls in this category. The non-verbal histogram indicates similarities between the genders.
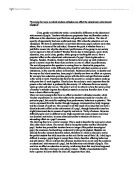
Another use of the results is to chart verbal test scores against non-verbal. This graph is divided into four sections by the blue lines into quadrants A-D.
Pupils in quadrant B are viewed as the most academically able and the school groups these pupils into the higher ability sets along with pupils near the middle of the quadrants to try and raise their achievements. There are nine teaching groups in total and they are divided into three bands of top, middle(bridging) and bottom(SEN). There is one SEN class per year group and 2-3 bridging groups depending on the intake and the rest distributed as top band.
As non-verbal ability increases towards quadrant D, pupils should show higher cognitive ability but have poor language (verbal) skills. This may mean poor performance in tests and reflectively there are 31 boys in this quadrant and 21 girls. Adversely, this may lead to pupils being misplaced in the setting system and labelled less bright than their quadrant A counterparts. This group is expected to prefer teaching that targets their kinaesthetic ability.
The bold diagonal black line is the line of equivalence which is used to predict results. Pupils scoring above the line should perform better than their prediction and if lower, then worse. This is used for target setting.
The green shaded area indicates pupils with severe learning difficulties and have the lowest potential of the year group. Nearly all the pupils in this section would be SEN and analysing the SEN teaching group, 60% of the pupils are boys.
The red lines mark the standard deviation, so the square in the centre is where most pupils lie. Pupils in the upper right hand corner, separated by the red lines, are in the top 10% of the year group. Of these, there is an even (50:50) distribution of boys and girls.
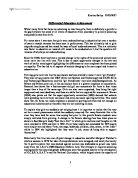
Quantitative scores are plotted against non-verbal scores to measure the year groups mathematic ability
Referring to the blue diagonal line, the higher a pupil scores, the higher their ability is in Maths. However, if a pupil is scoring underneath the line, then, although their quantitative ability doesn’t match the pupil has more understanding and can apply numbers more easily. Pupils above the line have more difficulty with this aspect of maths (also associated with applying numbers in science) whereas pupils close to the line have a good balance between their quantitative and non-verbal reasoning skills.
Further analysis of their teaching groups reveal, where possible, a balanced number of boys and girls in each class. However, option choices in Y9 leads to a stereotypical divide. In Y10 there are more girls taking compulsory single science and more boys opting for double and triple science. There are two parallel top and middle sets in double science and it is common to promote borderline pupils into a higher set to try and improve their motivation. The past GCSE results indicate a very small gender gap, favourable to girls. Since the gap is minute, gender in science is low priority in the faculty. However, they trust that skilled and varied teaching techniques would allow for differentiation and the school’s gender policy is used as a guideline to maintain gender balanced lessons.
Conclusion
I have focused on learning styles. It was soon realised that there are many classifications depending on situation and direction of study. These learning styles are open to criticism because it depends on the researchers classification. In the schools that I have been placed, they have both used CAT and it was logical to consider a commonly used test. The results are used to analyse verbal, non-verbal and quantitative reasoning.
Evidence from the CAT scores is concurrent with the research. Boys are better at manipulating numbers, which is important in Science and Maths and girls are better at verbal reasoning. The latter could partially explain why the gender gap in favour of girls is greater in English and the languages. From research findings and my observations at school I have found that pupils take on stereotypical subjects. Girls are less likely to take science (double/triple award) and even less likely to have a career in engineering or the sciences.
Boys are broadly distributed in comparison with girls, in the school I have studied. It might indicate that the majority of boys are matching girls and some outperforming. Equally, the higher percentage of lower ability boys not making A*-C means that overall, boys are seen as underachieving.
As a student the emphasis that ‘boys are underachieving’ is left quite open-ended. Interpreting this I wasn’t sure if that meant more time should be spent helping boys to raise their achievement and if I should adjust my teaching style to help boys. This concern was reflected in the introduction, would this be at the expense of girls education? The evidence that girls are predicted higher than their actual grade compared to boys who are underestimated is worrying because this may emphasise that teachers consider boys are less intelligent. A lot is to do with professional judgement but I will certainly think twice before making a predicted grade and make sure I am judging by ability and not character.
Inherent differences in gender are psychological, biological and social. In fact, there are other issues to be concerned about such as culture and class. Above all, we are concerned about equity. There is never purely one factor that could explain the differences even though various studies try and isolate them. Such studies draw on generalisations and people do not fit exactly into them. There are extremes of distribution and we are not confined to stereotypes. As teachers we aim to give pupils choice to do so by knowledge and education.