Question : 1
1.1 Theory of Predicted Result
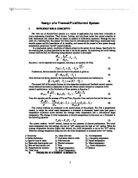
Identify Gp(s), the transfer function of the pendulum in both the upright and hanging configuration. Adjust the mass so that it is flush with the end of the rod. The length of a pendulum is the distance from the pivot centreline to the centre of mass. The centre of mass can be found by unscrewing it from the carriage and finding where it balances.
The position of pendulum bob (y), the position of the carriage (x) and the angle of the pendulum () are related by the equation:
The L is the effective length of the pendulum, the distance between the pivot and the centre of mass of the combined pendulum and bob.
Figure 2: Determine the mass position
According to the Lagrange Equation, , where L = T – V
T = kinetic energy
V = potential energy,
m = the mass of the block
Assuming v1 is the velocity of the pivot point and v2 is the velocity of the block, they can be expressed in terms of x and θ as follows:
--------------------------------------------------------------------------(1)
------------------------------------------------(2)
Using the Lagrange Equation, where L=T-V
--------------------------------------------(3)
Substitute (1) and (2) into equation (3)
According to Euler-Lagrange Equations
Small angle approximation
When the angle is so small that the pendulum attains only small amplitude,
Θ ≈ sin θ and cos θ ≈ 1
Therefore,
1.2 Numerical Analysis Result
In this section, the carriage module is turned upside down so that the pendulum acts as a crane. The pendulum swings naturally into an equilibrium position with the centre of mass below the pivot. The problem is now to control the linear position of the load which possesses very oscillatory dynamics.
Figure 3:
From the graph above show that Time period between 2 peaks is around 1s
So substitute time period,T in to undamped natural frequency equation,
If the sign of the acceleration due to gravity is reversed, the poles of the plant transfer function become imaginary and the model is that of a pure oscillator with an undamped natural frequency.
So, determine the length of the pendulum.
Given, , Since
= 24.85cm
It is very minor different value of the length of pendulum compare to analytical methods of original length which is 25cm, it differs by decimal points.
The logarithmic decrement, , it take from two amplitudes, and , separated by n complete cycles which mean between two peak voltage result and for lightly damped systems and factor, can be estimated from the log decrement.
According to the data table above, the result of damping is very minor value but not as zero.
Therefore, substitute the damping into equation of
Determine plant model, since Gp is to have units of radians/inch. So, g must be expressed in units of inches/sec2
The next task is to determine the characteristics of the internal servo loop.
Question : 2
The following question begins by familiarization of the Pendulum Control Unit and its dynamic characteristics. As the experiment progress, the cover the control of the pendulum control unit by both analogue and direct digital control methods. As a part of the experiment various monitoring, interconnections will need to be made on the control console. To ease the understanding, we have referred to the 4mm terminals and the control knobs as shown in Figure 4.
Figure 3: The Pendulum control module
2.1 Modelling of the Carriage Servo
In this experiment we will obtain a transfer function of the carriage servo. To do this properly needs a frequency response analyses, but the method described here is a simple method for obtaining an approximate second order model.
Fulfilling the requirement of this question, ensure to identifies Gs(s), the transfer function of the servo and carriage subsystem. First we are going to determine the bandwidth of the carriage servo. Apply a 1 Hz sinusoidal signal with peak to peak amplitude of 1 volt to the input of the servo (terminal H). Observe the carriage position on the Pico Scope.
The frequency at which this occurs is the bandwidth of the system wb. For a system with a damping ratio of 0.7, the natural frequency, wn, is equal to the bandwidth. Based on this approximation, calculate the natural frequency, wn. Hence deduce the transfer function of the servo-subsystem assuming that the damping ratio is 0.7
So, the system whose bandwidth is 9.6Hz and a damping ratio of 0.7 has the approximate transfer function -
2.2 Dynamic Model of the Pendulum
In this part of the experiment we will model the dynamic behavior of the pendulum. We shall do this by observing the transient response of the system from an initial value. Screw the pendulum rod firmly into the carriage. Tip the rig upside down so that it is in the crane position.
Displace the pendulum by about 30o, release it and record the transient response. After 20 cycles and freeze the display. The value of the period obtained can be calculated theoretically from the basic dynamics of a simple pendulum. The well known formula for the period is , where L is the effective length of the pendulum and g is the gravity.
Using the logarithmic decrement,
[Refer to page 6]
From the logarithmic decrement, a, the damping ratio, may be calculated using the formula ,
The logarithmic decrement is 0.02, and then the damping ratio figure works out to be 0.00318. Then modify the damping ratio figure slightly to obtain a better overall fit to the observed response.
From the period, T, the natural frequency can be deduced assuming that the damping ratio is very small, . Since, T is 1s, and then wn is approximately 6.28 rad/s. Thus, with a natural frequency value of 6.28 rad/s and a damping ratio figure of 0.00318, the pendulum can be modeled approximately as a second order system --
Question : 3
Determine Kr, the conversion factor from tick marks on the set point slider to voltage. Use the Pico Scope to Measure this Voltage.
The data below is retrieved from experiment which to compare between the set point slider and Pico scope voltage. However, it was found that the data of the set point slider are proportional to the Pico scope voltage.
Figure 4: Data table of Set Point Slider vs. Pico Scope Voltage
Path items which carry from the graph and it shows the most precise and accurate value built from the experiment to define the conversion factor from tick marks, Kr. According to the Fig 5 graph, the equation line of the chart shows the precise value of gradient result which is Kr =1.072. Beside, the R-squared value on the chart would be R2 = 0.9961, this can be seen in Figure 5.
Figure 5: The graph of Set Point Slider vs. Pico scope
Question : 4
Determine Kx, the conversion factor from carriage-position feedback voltage to inches. Do this by driving the carriage by connecting a wire from the set point slider (terminal A) to the servo amplifier input (terminal H) and measuring position with a scale or tape measure.
The data below is retrieved from experiment which to compare between the displacement of carriage and Pico scope voltage. However, it was found that the data of the displacement of carriage are proportional to the Pico scope voltage.
Figure 6: Data table of Displacement of Carriage vs. Pico Scope Voltage
Path items which carry from the graph and it shows the most precise and accurate value built from the experiment to define the conversion factor from carriage-position feedback, Kx. According to the Fig 7 graph, the equation line of the chart shows the precise value of gradient result which is Kx =2.62. Beside, the R-squared value on the chart would be R2 = 0.9997, this can be seen in Figure 7.
Figure 5: The graph of Displacement of Carriage vs. Pico scope Voltage
Question 5 & 6
Determine Kp, the conversion from pendulum angle to volts. Do this by measuring (terminal K) and the angle of the pendulum.
Fulfilling the requirement of this question, to determine the conversion from pendulum angle to volts. First of all, the Picoscope of voltage was -1.56V when the pendulum of cart moves to the left end of the point. Beside, when pendulum cart shift to end of the right side and the voltage were be 1.61V.
During experiment get constant peak value from Picoscope between channel A and channel B sinewave. So, the constant sinewave value which is = 5.803v equal
Using trigonometric to calculate the angle of
When &,
&
When & ,
Determine Ka, the constant used to calculate the center of gravity position Vy from carriage position Vx and pendulum angle .
Since = 5.803V & from picoscope reading value.
Simulation and Modeling
Initially we will neglect the dynamics of the carriage servo, assume that its response time is very fast in comparison with the pendulum. The inverted pendulum can be linearised and modelled by the transfer function
Part 1
Obtain the root locus for the system (both) without compensator.
For each case: (a) can the system be stabilized by setting Kc?
(b) What kind of stable performance can be achieved (overshoot, settling time, etc.)?
Observe the system’s velocity response to an impulse force applied to the cart it is not stable in open loop. Since settling time =Infinity and Steady state error = Infinity. Inorder to bring the pendulum under control , by control mean back to vertical position after the impulse force has been applied and following these performance specification :
- Settling-Time = Within 5 seconds
- Steady State Error = less than 3 degree
Part 2
Design a compensator for each configuration using the two parallel RC plugs provided. Note that the compensator is an OpAmp wired in an inverting configuration with a gain of –Zf/Zi. The console denotes the open loop OpAmp gain as –A because the internal wiring of the console inverts the gain to make the compensator gain Zf/Zi. What type of compensator did you choose and why? What
is the compensator transfer function?
For the Bytronic Pendulum,
The choice and design of the compensator is
Part 3
Obtain the root locus plot for both systems with the compensators included. For each case, what range of Kc results in stable operation? Plot step responses for several values of Kc. Include the following trials:
(a) all marginally stable values,
(b) a value to produce quick settling,
(c) a value to produce low overshoot,
(d) a good compromise (use your judgement, but describe what you are trying to accomplish)
(e) a value that ensures stability in the face of parameter variation (a robust design).
Using the mathlab to determine the compensator transfer function, which
However, from the graph show that
Real Zero: 0.98
Real Pole: 0.8
Max Delta Phase: 56.934
Frequency: 6.6238
According the graph below shows that the overshoot, setting time and the peak amplitude when K=40. Besides, it also takes all the record of the percentage of overshoot and setting time in different range of K. This can be seen in data below.
Part 4
For both configurations, wire up the control system using your compensator designs and test the response using the values of Kc chosen above. How does the system perform in comparison to your theoretical expectations? Any surprises? Explain any differences you see.
From the data above shows that when K=10 the overshoot has a lowest percentage compare with other. However, the setting time of K=15 has a lowest time which is 0.0599s. Therefore, the K between 10-15 is the most suitable gain to control the system.
Discusion and Conclusion
The purpose of this assignment is to extend the our skills in modeling and simulation of electro-mechanical control systems and to design control systems using advanced methods to modify performance.
The objectives of the assignment were achieved by design and implement controllers to modify the performance of a electro-mechanical system. However, it should be able to simulate the dynamic performance of a mechanical system.
An inverted pendulum is a pendum which has its mass above its pivot point. Wheareas a normal pendulum is stable when hanging downwards, an inverted pendulum is inherently unstable, and must be activetly balanced in order to remain upright by moving the pivot point horizontally as part of a feedback system. However, the inverted pendulum is related to rocket or missile guidance, where thrust is actuated at the bottom of a tall vehicle.
Bytronic Pendulum Control System
| Page