Determine the Mean Radiant Temperature (θr) and the dry resultant temperature (θres) in the room, using the formulae provided on an additional sheet.
Diameter of Globe Thermometer in m 0.038m
Radiant Response Ratio of Globe Thermometer
g = _ 1 _
(1 + 1.13V0.6 d – 0.4)
g = _ 1 _
(1 + 1.13 (0.17) 0.6 0.038– 0.4)
g = _ 1 _
(1 + 1.13 (0.35) (3.7))
g = _ 1 ___
(1 + (0.39) (3.7))
g = _ 1 _ = 1__ = 0.41
1 + 1.46 2.46
Mean Radiant Temperature
θr = 1 [θg – θa (1 – g)]
g
θr = 1__ [24.2 – 22.7 (1 – 0.41)]
0.41
θr = 2.44 [24.2 – 22.7 (1 – 0.41)]
θr = 2.44 [24.2 – 22.7 (0.59)]
θr = 2.44 [24.2 – 13.39]
θr = 2.44 [10.81] = 26.38ºC
Dry Resultant Temperature
θres = θr + θa √10v
1 + √10v
θres = 26.38 + 22.7 √10(0.17)
1 + √10(0.17)
θres = 26.38 + 22.7 √1.7
1 + √1.7
θres = 26.38 + 22.7 (1.3)
1 + 1.3
θres = 26.38 + 29.51 = 24.3ºC
2.3
Noise Analysis
4. The following data was measured in intervals of 10 seconds at a distance of 1m from the edge of a roadside:
4 (a) What is the L10 value (don’t forget units)?
79dB(A), which is the recorded sound level, which is exceeded 10% of the measurement period. See table above.
4 (b) What is the L90 value, (don’t forget units)?
65dB(A), which is the recorded sound level, which is exceeded 90% of the measurement period. See table above.
4 (c) What is the Leq value for this data (Hint - it’s the mean value ie convert each dB value to watts and then divide by 20. Finally convert average watts back to dB(A))
(1.59 x 10 -5) + (3.16 x 10 -6) + (5.01 x 10 -5) + (5.01 x 10 -5) + (2.51 x 10 –5) + (1.26 x 10 –5) +
(1.26 x 10 –5) + (6.31 x 10 –6) + (3.16 x 10 –6) + (7.94 x 10 –5) + (3.16 x 10 –5) + (1.26 x 10 –5) + (5.01 x 10 –4) + (1.59 x 10 -6) + (3.16 x 10 –6) + (5.01 x 10 –5) + (2.51 x 10 –5) + (1.59 x 10 –5) + (3.98 x 10 –6) + (5.01 x 10 -6) / 20
(5.01 x 10 –4) + (1.59 x 10 -5) + (5.01 x 10 -5) + (5.01 x 10 -5) + (2.51 x 10 –5) + (1.26 x 10 –5) +
(1.26 x 10 –5) + (7.94 x 10 –5) + (3.16 x 10 –5) + (1.26 x 10 –5) + (5.01 x 10 –5) + (2.51 x 10 –5) + (1.59 x 10 –5) + (3.16 x 10 -6) + (6.31 x 10 –6) + (3.16 x 10 –6) + (1.59 x 10 -6) + (3.16 x 10 –6) + (3.98 x 10 –6) + (5.01 x 10 -6) / 20
(5.01 x 10 –4) + (38.11 x 10 –5) + (26.37 x 10 –6) / 20
(5.01 x 10 –4) + (3.81 x 10 –4) + (2.64 x 10⁻⁵) / 20
(9.08 x 10 –4) / 20 = 4.54 x 10⁻⁵
Lw = 10log x (W/10-12 )
Lw = 10log x (W/10-12 )
= 10log x ((4.54 x 10⁻⁵)/10-12 )
=10log x 45400000
=76.58dB
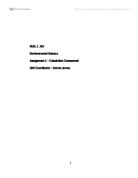
5. Plot the following on NR curves and determine whether it conforms to the Noise Rating for a library.
(Industrial Acoustics, 2009)
The nearest NR curve to the highest point on the graph is NR40, which as we can see from the table below is just within tolerance for a library.
Acoustics
6. A solid wall, whose dimensions are 9.5m x 6.5m, has a Sound Reduction Index (SRI) of 42dB at 500Hz. In order to facilitate visual communication between the areas separated by a wall, a window (SRI = 30dB at 500Hz) is to be installed in the wall. Calculate the maximum area if the SRI of the wall/window partition is not to fall below 35dB.
Atotal.τtotal = Awall. τwall + Awindow. τwindow
R = 10log(1/ τ)
7. Calculate the optimum and actual reverberation times at 500Hz for a hall of volume 2400m3 so as to be satisfactory for choral music using the following data. Allow 45% for shading the floor.
Data:
Item Area (or no.) Absorption coeff.
(m3) at 500Hz
Wood block floor 180 0.04
Stage 95 0.32
Unoccupied seats 40 0.15/seat
Audience 200 0.4/person
Ceiling plaster 160 0.15
Canvas scenery 96 0.3
Perforated board 115 0.32
Glass 45 0.12
Plaster on brickwork 210 0.03
How many additional absorption units are required to make the actual reverberation time equal to the optimum?
A = Sa
A = (a.α) RTactual = 0.16V/ Atotal Atotal = ∑(a.α)
Item Area (or no.) Absorption coeff. Absorption Units
(m3) at 500Hz (m2 sabins)
Wood block floor 180 x 0.55 0.04 3.96
Stage 95 0.32 30.4
Unoccupied seats 40 0.15/seat 6
Audience 200 0.4/person 80
Ceiling plaster 160 0.15 24
Canvas scenery 96 0.3 28.8
Perforated board 115 0.32 36.8
Glass 45 0.12 5.4
Plaster on brickwork 210 0.03 6.3
Total 221.66m2
[NB - r = 6 for choir]
Optimum RT -
Actual RT -
Additional Absorption Units Required -
238.51 – 221.66 = 16.85m²
8. The following data was gathered from a standard sound transmission test on a partition.
Calculate the DnT,W for this partition.
DnT = (Lp/T – Lp/Rc) + 10log (RT/0.5)
100Hz DnT = (102.0 – 54.9) + 10log (0.74/0.5) = (47.1) + 10log (1.48) = 47.1 + 1.70
= 48.80dB
125Hz DnT = (104.0 – 72.4) + 10log (0.53/0.5) = (31.6) + 10log (1.06) = 31.6 + 0.25
= 31.85dB
160Hz DnT = (111.0 – 73.1) + 10log (0.46/0.5) = (37.9) + 10log (0.92) = 37.9 + (-0.36)
= 37.54dB
200Hz DnT = (111.0 – 71.0) + 10log (0.73/0.5) = (40.0) + 10log (1.46) = 40 + 1.64
= 41.64dB
250Hz DnT = (113.0 – 65.3) + 10log (0.65/0.5) = (47.7) + 10log (1.30) = 47.7 + 1.14
= 48.84dB
315Hz DnT = (105.0 – 66.1) + 10log (0.44/0.5) = (38.9) + 10log (0.88) = 38.9 + (-0.56)
= 38.34dB
400Hz DnT = (112.0 – 67.2) + 10log (0.71/0.5) = (44.8) + 10log (1.42) = 44.8 + 1.52
= 46.32dB
500Hz DnT = (108.0 – 67.4) + 10log (0.67/0.5) = (40.6) + 10log (1.34) = 40.6 + 1.27
= 41.87dB
630Hz DnT = (111.0 – 65.7) + 10log (0.77/0.5) = (45.3) + 10log (1.54) = 45.3 + 1.88
= 47.18dB
800Hz DnT = (115.0 – 64.3) + 10log (0.75/0.5) = (50.7) + 10log (1.50) = 50.7 + 1.76
= 52.46dB
1000Hz DnT = (105.0 – 66.7) + 10log (0.88/0.5) = (38.3) + 10log (1.76) = 38.3 + 2.46
= 40.76dB
1250Hz DnT = (103.0 – 56.3) + 10log (0.83/0.5) = (46.7) + 10log (1.66) = 46.7 + 2.2
= 48.9dB
1600Hz DnT = (105.0 – 57.2) + 10log (0.77/0.5) = (47.8) + 10log (1.54) = 47.8 + 1.88
= 49.68dB
2000Hz DnT = (104.0 – 55.3) + 10log (0.85/0.5) = (48.7) + 10log (1.70) = 48.7 + 2.3
= 51dB
2500Hz DnT = (104.0 – 53.7) + 10log (0.77/0.5) = (50.3) + 10log (1.54) = 50.3 + 1.88
= 52.18dB
3150Hz DnT = (101.0 – 43.4) + 10log (0.88/0.5) = (57.6) + 10log (1.76) = 57.6 + 2.46
= 60.06dB
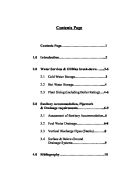
DnT,W – See Graph on following page
5+6+2+10+3+2+1= 29 = 1.81
16 16
graph
Lighting
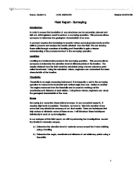
9(a). The following Illuminance (E) data was collected using the physics laboratory Hoop Photometer on a standard GLS lamp. Using the standard formula convert these values to Luminous Intensity (I) and plot them on a polar diagram
I = Er2
Assume – Distance (r) = 0.57m as per workshop experiment
Therefore r2 is 0.3249
e.g. 171 x 0.3249 = 55.56
See Table on following page for remaining calculations
9(b). Calculate the total luminous flux emitted from this lamp
Ø zone = I mean x Zone Factor (Z F)
I mean = (IØ1 + IØ2)/2
Total flux (Ø) = ∑ Øzone
(See table overleaf)
Right Hand Side of Hoop
Total Luminous Flux RHS - 631.55
Left Hand Side of Hoop
Total Luminous Flux LHS - 654.21
Total Luminous Flux Emitted - 631.55 + 654.21 = 1285.76 lumens
Polar diagram
Daylighting
10. A model of a room was placed in the artificial sky and the following illuminance measured on the grid plan shown below:
Illuminance (lux), outside illuminance = 2,500 lux
The illuminances were measured on a 5 x 10 grid, 50mm apart, with the first and last grid points only 25mm from walls. Rows are at 25mm, 75mm, 125mm, 175mm, 225mm, 275mm, 325mm, 375mm, 425mm and 475mm. Columns are at 25mm, 75mm, 125mm, 175mm and 225mm.
Data:
Reflectances:
Wall 55%
Floor 35%
Ceiling 75%
Glass Transmission 0.8
-
Plot the 2%, 5% and 10%, daylight factor contours for this room on a scaled drawing.
- Use Littlefair’s formula to calculate the average daylight factor
DFave = __TWθ___
A(1 – R2)
DFave = 0.8 x 15 x 84
140(1 -
- Calculate the uniformity.
There are no external obstructions, assume θ to be 84°
Heat Pump
11. The physics laboratory heat pump has been used to collect the following data for two different condenser flow rates:
Using the formulae provided calculate the Coefficient of Performance (COP) for each flow rate and hence find the average COP.
C.O.P = Pd
W
Where Pd is the heat dissipated to the high temperature environment and W is the electrical power supplied to the heat pump.
Pd = m.CH20 (θ6 – θ5)
W = 1 .3.6 x 106 . 1
200 t
Pd = 0.19 x 4.2 x 103 (11.5 – 9.6) = 798 (1.9) = 1516.20
W = 1 .3.6 x 106 . 1 = (0.05) 3.6 x10⁶ (0.02) = 3600
200 63
C.O.P. effective = Pd = 1516.20 = 0.42
W 3600
Pd = 0.16 x 4.2 x 103 (13.1 – 9.6) = 672 (3.5) = 2352
W = 1 .3.6 x 106 . 1 = (0.05) 3.6 x10⁶ (0.02) = 3600
200 65
C.O.P. effective = Pd = 2352 = 0.65
W 3600
Average C.O.P. = (0.42 + 0.65) = 0.54
2
References
Building Design (2008), CIBSE Psychrometric Chart, [Online]. Available from:
[Accessed 4 May 2009]
Industrial Acoustics (2009), NR Chart, [Online]. Available from:
[Accessed 4 May 2009]
Bibliography
McMullan, R (2007), Environmental Science in Building (6th Edition), Basingstoke: Palgrave Macmillan