Having identified the key features of the Demographic Transition Model, I can determine whether it can be interpreted as a reliable and accurate representation of Europe’s demographic past.
The table below charts how the European population has changed from 1500 to the present day.
The total population of Europe in 1AD stood at a mere 31 million. Between the birth of Christ and the 18th century the population trebled as a result of successive waves of expansion and crisis. Crisis’s occurred during the late Roman Empire and the Justinion era due to barbarian invasions and disease. In 1000 AD Europe began a phase of growth, which would last for 3 centuries, increasing the population by a factor of three. Settlements multiplied, new cities were founded, abandoned areas were inhabited and cultivation spread to less fertile lands. By the end of the thirteenth and beginning of the fourteenth centuries growth began to slow; crisis occurred more frequently, settlements ceased to expand, technological progress halted and the best quality land became depleted. Recurring and devastating bouts of the plague beginning in the mid fourteenth century caused further crisis. Between 1340 and 1400 Europe suffered from a massive population decline of almost a third, the population at that time standing at 80 million. The Black Death of 1348 was one of the most violent checks to demographic growth, due to the first explosion and the relentless cycles that followed. It was only until the sixteenth century that the population of Europe returned to that of 1340, due to expansion through a strong rallying. All the same, the plague continued to check population until virtual disappearance in the second half of the seventeenth century. In 1630, plague wiped out almost half the population of Milan, and that of 1656 wiped out half the populations of Genoa and Naples. The plague had disastrous effects on Europe as a whole, as it struck urban and rural populations with equal violence. Cities emptied within oversized urban boundaries, villages became abandoned and the countryside deserted, labour shortages caused salaries to rise and an abundance of available land lowered the price of food. Population decline was firstly a result of the obvious increase in mortality and secondly the spread of disease lowers the frequency of conception, births and marriages, which accentuates the negative demographic action of the epidemic. In conjunction to this there may be a temporary increase in overall fertility due to a small rebound effect to compensate.
Before 1750, Europe was a traditional agricultural society, demonstrating the key features of stage one of the demographic transition model. High, random and unpredictable mortality caused by frequent and irregular crisis’s slashed away all sectors of ages and classes. A high probability of young would die before their parents. Taking France as an example, in the period around 1740, there was a one in four chance that a 40-year-old mother would outlive her 10-year-old son.
From 1750 until the present day forces of modern expansion have come to the fore. Eighteenth century Europe entered a phase of economic, demographic and social change of great importance. A gradual relaxation of societal control exercised by traditions, institutions and religions, coupled with economic and social development of society caused the beginning of the Industrial Revolution. Mortality rates declined, accelerating population growth, thus Europe progressed into stage two of the model. Between 1600 and 1750 the rate of population growth was 0.15% meanwhile between 1750 and 1850 this figure rose steeply to 0.63%. The Industrial Revolution brought with it an increase in population and urbanization, as well as new social classes. The increase in population was nothing short of dramatic. All major European countries were subject to rapid demographic increase, though some to a greater degree than others. England and Germany showed a growth rate of something more than one percent annually; at this rate the population would double in about seventy years. Only the population of France tended to remain static after the eighteenth century. The general population increase was aided by a greater supply of food made available by the Agricultural Revolution, and by the growth of medical science and public health measures, which decreased the death rate and added to the population base.
When beginning an account of long-term population changes it is convenient and logical to firstly discuss mortality decline. The fall in mortality usually preceded the equally fundamental changes in fertility and fertility changes are best understood against the background of falling death rates.
Causes of mortality declines during the period of the Industrial Revolution resulted from biological, economic or social changes. The reduced frequency and intensity of epidemic cycles and disappearance of the plague were key factors. Due to better economic organization, agricultural progress and improved transportation, thus distribution of goods, the incidence of famine was reduced. Socio cultural practices helped to reduce the spread of infectious diseases and improve survival rates, especially those of infants. Improved social conditions, public and private hygiene, reduced the transmissibility of infection.
Medicine before the 1750’s wasn’t well developed. Once infection set in, nothing was possible to save the patient. Various diseases couldn’t be stopped or controlled because of limited technology. During the process of industrialisation however, progress was made in the control of infectious diseases. Vaccinations were discovered and administered. Jefferson’s discovery of the smallpox vaccine in 1798, and the identification of pathogens responsible for the most devastating epidemics, considerably aided the process of mortality decline. X rays were also discovered and provided doctors with a faster way of diagnosing medical problems. Louis Pasteur discovered and fabricated a way to eliminate all germs in milk. Called pasteurisation, this technique involving heating the milk to slow the fermentation process, is now widely used on all milk.
Mortality declined because of a decline in the probability of death at the various ages during normal periods, therefore life expectancy lengthened. In Europe mortality transition was relatively slow, the median date for European countries to reach a female life expectancy of 50 was 1903.
Fertility decline in Europe followed mortality decline, thus matching the pattern of the Demographic Transition model. Fertility decline, like that of mortality, was a gradual and geographically varied process. Prior to transition European levels ranged from a low of about 30 per thousand to a high above 45, present crude birth rates for the United Kingdom stand at 12 per thousand. France preceded the rest of Europe, beginning fertility decline in the period between 1780 and 1850, thus is an exception. Whereas in the majority of the remainder of Europe, the date of decline falls between 1890 and 1920; the most crowded decade is 1900-10. Because of this difference, it is difficult to group Europe together as a whole; different European countries demonstrate differing demographic transitions. For the purpose of this essay I am focusing on general trends within Europe.
Fertility declines can be explained by social and economic indices, such as levels of education, rurality, industrialization or urbanization or by cultural factors such as, membership in a linguistic or ethnic group, religious or political affiliation. The decline in birth rate in late nineteenth century Europe was chiefly socially determined. In an industrial society, many children in the family were something of a liability during their upbringing, and not much insurance against their parents’ old age.
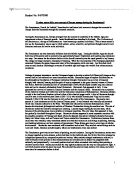
The theories of Wrigley and Schofield, suggest that the population increase and demographic transition demonstrated by England, was due to a rise in fertility and not due to a fall in rates of mortality. They suggested that fertility trends followed real wage trends, although with a lag of roughly 40 years, throughout the period and conclude that the demographic expansion of the late eighteenth century was not a revolution, but fitted a long-standing pattern of English demographic history. The reconstruction of Wrigley and Schofield has completely overturned the demographic transition theory for England. Though falling mortality appears to have made a modest contribution, the main source of population growth in England during the late eighteenth and early nineteenth centuries was a considerable rise in fertility. If this theory were to be proved, it would appear that the demographic transition model doesn’t provide an accurate representation of England, and therefore Europe’s demographic past. However, the diagram following shows changes in fertility and mortality between 1700 and 1940 in the United Kingdom, and indicates no such rapid rise in birth rate.
From historical evidence it would appear that the demographic transition model provides a representation of Europe’s demographic past. Population increase occurred due to death rate decline followed by birth rate decline, and the present situation is one of stability. Yet the model fails to incorporate currents of migration, which significantly altered the demographic structure of Europe in lowering European demographic pressure. European transoceanic migration between 1846 and 1932 went primarily to the United States and emigration was certainly beneficial from the viewpoint of aggregate economic growth.
Birth rate and death rate are the chief variables in the demographic transition model. It is the interaction between and changing rates of these factors that causes demographic change. The crude birth rate is the number of live births per 1000 persons in the population. It is a crude measure of fertility because it is based on the entire population rather than on the segment of the population who can actually give birth: women of childbearing years. In general, a crude birth rate below 20 can be considered low, and suggestive of low fertility, small families and so forth. A crude birth rate between 20 and 30 or 35 is moderate, typical of countries where fertility has fallen a fair amount but has not yet reached the low levels observed in developed countries. A rate above 35 is fairly high, and indicative of fertility that has not fallen much. Crude death rate is simply the number of deaths per 1000 persons in the population. Measuring crude birth and death rates may appear to be simple in our age of high technology and communication, yet in remote areas data for these variables is often very misleading. When looking at past European demographic data, caution must be taken and the reliability of the data questioned. In many countries the census is highly defective but attempts have been made to improve and to standardize international methods of census taking. Sample surveys are often taken in an endeavour to collect information that would be impossible to collect for the whole population, yet these may jeopardise the reliability of the data.
The crude birth rate, as a summary measure, nevertheless has some serious problems. While useful in comparison with the crude death rate and the crude migration rate to determine whether or not a country's population should be growing or shrinking, it is sensitive to the age distribution of the population for which it is being calculated. In particular, even if women of the same ages in two different societies on average have the same number of births, the crude birth rates calculated for the two societies may differ. The crude birth rate includes people who are usually not capable of having births, for example, men, women under age 13, and women over age 50, thus even if the birth rates of women capable of having births (that is women aged roughly 13 to 49) doesn't change, the crude birth rate of a population can change if the number of men in the population changes, or if the number of women below age 13 or above age 50 changes.
This introduces problems if we want to compare fertility trends or patterns in populations different age structures. In general, younger populations, that is, populations with a higher concentration of people, especially women, in the young adult years, will have higher crude birth rates than populations with higher concentrations of people in older ages, even if the fertility behaviour of women in the two populations is absolutely identical. For example, even if for some reason the childbearing patterns of women in the U.S. and Mexico were identical, in the sense that women of the same age were equally likely to give birth in the two countries, Mexico would exhibit a higher crude birth rate than the U.S. right now because a higher proportion of its population, especially its women, are concentrated in the young adult years.
This is a problem because usually when we are measuring fertility we want indices that represent the behaviour of the people actually capable of having births, that is women aged 13 to 49, and we are not really too interested in what is going on with all the other people. The point is that we want indices that allow comparisons of the behaviour of women of childbearing ages across time and between societies, indices that are not affected by differences over time or between societies in things like the number of men or the number of women above age 49 or below age 13.
Many countries still have high levels of illiteracy, especially those of the developing world. This poses a potential threat to accurate data collection. Remoteness also poses a threat. Remote and inaccessible areas with poor communications and transport links are difficult to accurately survey in order to obtain data relating to birth rate and death rate.
Previous estimates of early population size have poor reliability. Historical knowledge from partial censuses, parish registers, nominative lists for certain places and archaeological findings can give us clues to the possible historical population trends. The ‘back projection’ technique aims to estimate the number of people in the oldest closed age group as movement back in time occurs, and is used to estimate population size, migration, age distribution, fertility and mortality. However it has been proved that this technique cannot be used to reliably estimate the above factors.
The trend of population in history is no more than a convenient method of summarizing the experience of a society in time. The demographic transition and associated migration left European population profoundly changed, both dynamically and structurally. Although the Demographic Transition Model reflects the demographic changes in Europe, demographic change has not been free of crisis or disorder. French Revolution and Napoleonic wars devastated Europe for 20 years and in 1816-17 famine accompanied by an outbreak of typhus affected demographical change. The accuracy and reliability of these conclusions about Europe’s demographic past is determined entirely by the reliability of historical data. Statistical data from too few places, for too short a time and with too few cases is of little value to the demographer. To conclude, from the data sources I have analysed, I am of the opinion that the Demographic Transition model provides a simplified, reliable and accurate depiction of Europe’s demographic past.
C. McEvedy & R. Jones (1979) Atlas of World Population History (MP 117)
W. Thompson (1945) Population American Jnl Sociology May 959-975 – online
M. Livi-Bacci (1997) A Concise History of World Population 2nd Edition
E.A. Wrigley Population and History
T.H Hollingsworth Historical Demography
E.A Wrigley & R.S. Schofield (1983) English population history from family reconstruction Population Studies
37 154-184 –online
R. Lee (1985) Inverse projection and back projection Population Studies 39 233-248 - online