Procedure
The investigations were carried out in three stages:
-
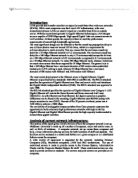
Firstly the program was altered to work out its percentage success rate of recognition of three patterns automatically as the noise increases from 0 to a suitable value then output the results to a file. The patterns tested were of horizontal, vertical, and diagonal stripes as figure 1 shows:
0 0 0 0 0 0 0 1 0 1 0 1 0 1 0 1 0 1
1 1 1 1 1 1 0 1 0 1 0 1 1 0 1 0 1 0
0 0 0 0 0 0 0 1 0 1 0 1 0 1 0 1 0 1
1 1 1 1 1 1 0 1 0 1 0 1 1 0 1 0 1 0
0 0 0 0 0 0 0 1 0 1 0 1 0 1 0 1 0 1
1 1 1 1 1 1 0 1 0 1 0 1 1 0 1 0 1 0
Horizontal Vertical Diagonal
Figure 1
Two functions were added, and one of them was called from the command loop in the main program.
The function how_successful works out the success rate of the neural network by recording the number of times the network successfully recognises the appropriate pattern out of a hundred tests, then calculates the average. It calls in a noise level set by the function success_graph which is assigned to the pattern being tested. The patterns are mixed up, so that the network does not get used to any one in particular.
float how_successful(int n)
{
float total=0;
for(int i=0;i<100;i++)
{
for(int j=0;j<3;j++)
{
set_stripes(j);
noise(n);
if(recognize()==j) total++;
}
}
return(total/300.0);
}
The function success_graph uses the how_successful function to obtain results for a range of noise levels (currently between 0 and 100) which are outputted to a file:
void success_graph()
{
ofstream grf("graph.dat");
for (int n=0;n<100;n++)
{
float hs=how_successful(n);
grf<<n<<","<<hs<<endl;
}
}
The network was initially trained on perfect data (i.e. with a noise level of zero). A graph of the results was plotted and analysed, then the network was trained with noise, plotting graphs for each noise level tested.
- The second stage was to change the program to produce a series of results automatically for different amounts of training. Another function was added to achieve this:
void autotraining()
{
ofstream grf("graph.dat");
for (int i=0;i<10;i++)
{
success_graph(grf);
loop_train(i);
}
grf.close();
}
The number of times the neural network was trained was varied from nothing to nine times.
A section was taken out of loop_train, as the input of data from the user becomes unnecessary.
-
Lastly the program was altered to read in some patterns from a file. Two pattern files were created, representing the digits 0 and 1. A function was added for each pattern and the function set_stripes was altered to look at the new functions selected_0 and selected_1.
void selected_0()
{
static not_read = 1;
if(not_read)
{
read("zero.dat");
for(int i=0; i<SIDE*SIDE; i++)
{
pattern_0[i] = pat[i];
}
not_read = 0;
}
for(int i=0; i<SIDE*SIDE; i++)
{
pat[i] = pattern_0[i];
}
}
void selected_1()
{
static not_read = 1;
if(not_read)
{
read("one.dat");
for(int i=0; i<SIDE*SIDE; i++)
{
pattern_1[i] = pat[i];
}
not_read = 0;
}
for(int i=0; i<SIDE*SIDE; i++)
{
pat[i] = pattern_1[i];
}
}
Discussion
The first stage of the investigation looks at how training to different noise levels affects the performance of the network. Figure 2 shows the results from training the network 5 times per level up to noise levels of 0, 10, 20, 30, 40 and 50. It is tested on patterns with noise levels up to a noise level of 100, and plotted against the average success rate from 100 tries. Training with no noise at all gives the network has a success rate of almost 100%, until it is tested at a noise level of 15, then the success rate drops off. The curve becomes asymptotic to a value of 0.33. This is to be expected, because very high levels of noise alter the patterns so much that they do not resemble the original pattern at all. The neural network is effectively just guessing at random when this occurs. If three patterns are used the network will obtain the correct result a third of the time on average.
When the training noise level is increased to 10 the success rate improves very slightly. Perhaps most significant is that the network produces near perfect results up to a noise level of about 20. Training up to a noise level of 30 seems to worsen the results. But they seem to recover again at 40, then get worse again at 50. Overall, training to a noise level of 10 produced the best results.
Since the patterns have an equal number of 1s and 0s (see fig. 1) the likelihood of any single point being altered is, on average, 50%. Because it can only be changed o a one or a zero, and it will already be one of these! For a noise level of 1 only one point in the grid is changed. So, for a noise level of 36, all the grid points could change, making the pattern totally unrecognisable. However, one grid point could also change 36 times, and end up where it started, leaving the pattern totally unchanged. It would be useful to conduct an experiment to find out how likely a point was to change, compared with the noise level. A noise level of 20 obviously represents a significant change in the pattern; at this level it is probably likely that at least 10 points have changed, although it could be none at all!
The likelihood that the random noise generator picks the same cell twice in a row is = 1/36 * 1/36 = 1 / 1296 or roughly 0.000772.
If it does this 20 times it becomes 20 / 1296 = 0.0154.
So it is quite unlikely that it will pick a particular cell twice for a noise level of 20.
For any one to be picked twice would be (20 * 20) / 1296 = 0.309. So, it is much more likely that one of the cells will be picked twice. The likelihood of picking one of the cells twice reaches 1 at a noise level of 36.
The second stage of the investigation was to produce a set of results for each level of training, for a number of training loops. The number of training loops was varied between 0 and 9. Figures 3 and 4 show that with no training at all the network produces a roughly straight line at a value of about 0.33, which is to be expected as there are three patterns. The network becomes much better when it has been trained. With just one set of training the network is almost as good as it is with 9 sets. All levels of training seem to follow roughly ha same line when comparing success rate with tested noise level. They start to drop away at about 15 and the lines become asymptotic to a success rate of 0.33. Figure 4 demonstrates that the training noise level has little effect on the results. But this was expected from the results produced in the first stage of the investigation. In order to more clearly see how the number of training loops affects the results, a graph of 0, 1, 2 and 9 loops was produced, and a line of best fit added to each (see fig 5). It can be seen that 2 loops produces almost exactly the same results as 9 loops, as if this is some kind of optimum curve; the network performs nearly as well with one loop. For the previous results the training loop is completed three times at each noise level. An experiment was carried out with a single operation at each level, and the results produced were almost exactly the same.
A more curious aspect of the results occurs when the network has not been trained at all. Figure 3 shows that there is some randomness involved, and the network is guessing the pattern, rather than working it out, the line for zero training loops has a mean value of approximately 0.33. Figure 4 also displays this phenomenon, but the network seems to be much more consistent, there is hardly any deviation from the mean value at all. The test has been completed several times and training at a noise level of 5 always produces a very similar set of results. Even more curious is that training to a noise level of 50 gives quite food results initially, for no training, quickly levelling out to a value of 0.33 (see fig 6). The maximum noise level trained to should have no bearing on these results, since the network has not been trained at all. Yet there does seem to be some subtle relationship.
Stage 3 of the investigation was to introduce different patterns to the network, representing the numbers 0 and 1. Figure 7 shows that the network is able to recognise these patterns just as well as the striped patterns. A higher average success rate is produced, since there are only two patterns, rather than three; the graphs tend to level out at a success rate of 0.5, which is to be expected. The results demonstrate that this network could be used to recognise any pattern or image. It could be used, for example, to recognise different types of tank from an aeroplane.
Conclusion
Artificial Neural Networks are generally very good at recognising patterns. A network can be trained with a relatively small amount of data to recognise patterns which have quite a large amount of noise. It starts to get worse at a noise level of 20. The network can recognise noisy images, even if the training patterns do not include any noise at all, demonstrating the systems inherent robustness. If the network is trained on slightly noisy data its performance will slightly improve. If it is trained on very noisy data its performance gets worse because the images no longer represent the original pattern, so the network I trying to recognise something that isn’t there. The more times you train a network up to a particular noise level, the better it gets. It is almost pointless in training this network more than twice on a set of noise levels because it hardly gets any better after that. The network can recognise different patterns, it had no problem recognising the digits 1 and 0, and there is no reason why it couldn’t be trained to recognise any image.
References
-
Evans, D (2002). Introduction to Artificial Neural Networks. (Lecture Notes).
- http://www.generation5.org/perceptron.shtml