I will collect the data by asking individuals to estimate when they think 30 seconds has passed from when I say go. I will attempt to not let each student know what they will be doing as it will give them no time to practice and will also not announce what time as estimated in front of other students as it could give them an unfair advantage.
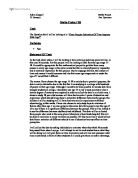
Data Table
The above table depicts data from 4 different age ranges that I specified in the statement of task. It shows clearly ages 15, 16, 17, 18 and 25+. It then gives the estimate in seconds of how long they thought 30 seconds was. At the side of the table it has a key giving us the reason for the yellow shaded boxes (the data collected from children that weren’t at the college it took data from).
Averages
Age: 15
Mean – 779 10 = 25.96667
Median – 26
Mode – 26
Range – 38 – 20 = 18
Age: 18
Mean – 839 30 = 27.96667
Median – 27.5
Mode – 28
Range – 35 – 24 = 11
Age: 25+
Mean – 436 15 = 29.0667
Median – 28.5
Mode - 28
Range – 11
Age: 18 (Out Of College)
Mean – 306 11 = 27. 8182
Median - 27
Mode –24
Range – 9
Graphs
Scatter Graph
The above graph is a scatter graph that shows the comparison between the three different age groups that I have looked at. As the key shows yellow is 25+, 18 is pink and 15 is navy blue. The bottom X-axis is the estimate number and the Y-axis is the time the estimated in seconds. It also has a line of best fit for each age group that will help us see the trend that each point on the graph follows. The graph shows that age 15 has a lower starting estimate value and a higher finishing value than the other two ages; this means that the range for this age is quite big. The range for age 18 and 25+ seems to be similar by looking at this graph because it has a similar stating and finishing value..
Line Graph
The above graph is using the same data as the scatter graph but is put in the form of a line graph. This graph gives a clearer example of how the different age groups differ in how they estimate time. It shows again what the scatter graph shows, the range’s for 18 and 25+ are similar and smaller than 15.
Bar Chart
The above graph shows the 3 different types of averages (mean median and mode) and the difference between all of them for each age group. Each average has 3 bars, orange being 15, red being 18 and green being age 25 and above. The graph shows that on average the mean is higher than the median and mode. It also shows that for age 15, the mean median and mode are very similar. The biggest difference is between the mode and the median for age 25+.
Scatter Graph
Unfortunately I could get a set of data for age 18 completely from 1 college due to the fact that there were not 30 18 year olds, so I had to collect some data from people I knew outside of college. This graph above shows the comparison between students in college and 18 year olds out of college, the navy blue line shows the values for people outside of school and the pink for values taken from people at college. The graphs shows that the two results have a very similar range (starting and finishing point), however, this can not be a completely accurate graph seen as more values were taken in school than outside of school.
Histogram
The above table shows the calculations we need to draw our histogram table. It has 3 columns, the range, the frequency and the frequency density
Cumulative Frequency for age 15
Age 18
These cumulative frequency tables give us the point to draw a cumulative frequency diagram.
Evaluation
Overall I fell this project has gone very well, the data was collected efficiently and the data processed into efficient charts, tables and graphs. The original data collected was only for two age groups ages 15 and 18, however, I felt that this did not give a very large range, even though I wanted this project to be based mainly around youngster, so I used data from people over the age of 25. This area is one of the first problems I encountered, the data set name is 25+, and I took this data from ages of 25 (my cousin) to over 70 (my Nan). If I were to do this test again, I would use a lot more age ranges and have them as close to each other, but due to time and availability I could not do this.
The second problem I faced was the age 18+ group, as this experiment was started in year 12, many of the students of the college had not reached 18 and was there for hard to get data fro the same school, therefore out of school sources were used. If I was to do this again I was have an equal amount of data form two different schools to see if education had any effect on the estimation ability.
The results I did collect however, were quite good, they were good enough to make a number of graphs including scatter graphs and cumulative frequency graphs, as well as making calculations for mean, median and mode.
Looking at the graphs we can conclude that the age group 25+ had the best mean average estimation of time with less that a second away. We can also see that age 15 is the worst being at around 5 seconds off. So we can conclude from looking at this experiment that estimation improves with age. However, as we did not look at a very old age group eg 85+, we do not to the full extent of this claim.