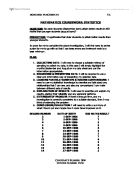
Interquartile Range
From the information from the Graphic Calculator, the
Interquartile range = Q3 – Q1
= 2 – 0
= 2
Box-and-whisker plot
The box-and-whisker plot shows that the probability distribution from minimum x value to median is 50%. From median to the 3rd quartile is 25% data and 25% of data lies between the 3rd quartile to maximum value. Same goes to the 1st quartile, from median to the 1st quartile is 25% and from the 1st quartile to minimum value is another 25% of data.
Standard Deviation
The standard deviation for the sample, s
By Graphic calculator, the standard deviation, s is 2.46.
This shows that the average deviation of the mean and the data of summonses received by students is 2.46.
Spike Plot
The spike plot shows the probability of students getting summons. The highest probability is 0.517 which is students do not receive any summons at all.
Conclusion
This investigation is divided into two parts that is the analysing of the centre distribution and the spread of the data. As for the centre distribution, it is found out that the average number of summonses received by student is 1.52 and the median is 0. It is also found out that the most number of summonses received is 0 which is the mode.
The second part of the investigation, the spread of data, shows how the data were distributed. The dot plot shows the numbers of student getting summons according to the sum of their summonses. For spike plot, it shows the probability of students who got 0, 1, 2, 3, and 4 summonses. The spread of the data can be seen when the box and whisker plot is constructed which shows that most data actually concentrated at 0.
As a conclusion, for sample of 60 female ABC University students from the period of June 2005 to June 2006, the highest probability of getting summonses which is 51.67%, is 0 summon. Also, the data are not evenly distributed as it tends to focused on 0, 1 and 2 summonses.
Investigation 2: Restrictions that female ABC University students wish to abolish
Number of ABC University female students who wish to abolish restrictions
Restriction 1: Short Shirt (does not cover bottom)
The Centre of a distribution
Binomial Distribution
X = Number of ABC University female students who wish to abolish the restriction of wearing short shirt which does not cover bottom
Sample size, n = 60
Probability of success, p = = 0.583
Probability of failure, q = 1 – p
= 1 – 0.583
= 0.417
Mean, μ = np
= 60(0.583)
= 34.98
≈ 35.0
Standard deviation, σ =
=
= 3.819
≈ 3.82
X ~ Bin (60, 0.583)
What is the probability that majority of the female ABC University students wish to abolish the restriction of wearing short shirt which does not cover bottom?
Pr (x ≥ 30) = 1 – Pr (x ≤ 29)
= 1 – binomcdf( 60, 0.583, 29)
= 0.9236
≈ 0.924
Normal approximation
Sample size, n = 60 n ≥ 30
np = 60(0.583) = 34.98 np ≥ 10 All conditions satisfied
nq = 60(0.417) = 25.02 nq ≥ 10
Mean, μ = 35.0
Standard deviation, σ = 3.82
What is the probability that majority of the female ABC University students wish to abolish the restriction of wearing short shirt which does not cover bottom?
Pr (x ≥ 30) = Pr (x * ≥ 29.5)
= Pr
= Pr (z ≥ - 1.440)
= normalcdf ( - 1.440, E99 )
= 0.925
Confidence Interval for a Proportion
To estimate the proportion of female ABC University students who wish to abolish the restriction of wearing short shirt which does not cover bottom, a sample proportion is examined.
Sample size, n = 60
Number of success, x = 35
Sample proportion, =
=
= 0.583
= 1 –
= 1 – 0.583
= 0.417
Confidence level = 95 %
Confidence interval
0.459 < p < 0.708
We are 95% confident that the actual proportion of female ABC University who wishes to abolish the restriction of wearing short shirt which does not cover bottom lies between 45.9% and 70.8%.
The effect of increasing sample size, n on confidence interval
Consider samples of different size but all with p = 0.583 and q = 0.417 at 95% confidence level.
Sample size, n = 20
0.367 < p < 0.799
Sample size, n = 40
0.430 < p < 0.734
Sample size, n = 80
0.475 < p < 0.691
Sample size, n = 100
0.486 < p < 0.680
For various values of n we have:
We see that increasing the sample size, n produces confidence intervals for proportion of narrower width.
The effect of increasing confidence level on confidence interval
Consider different confidence level but all with p = 0.583 and q = 0.417 with sample size, n = 60.
Confidence level = 90%
0.478 < p < 0.688
Confidence level = 98%
0.435 < p < 0.731
Confidence level = 99%
0.419 < p < 0.747
For various values of confidence level, we have:
We see that increasing the confidence level produces wider confidence interval.
Conclusion
By using binomial distribution and normal approximation, we discover that the chance of majority of the female ABC University students who wish to abolish the restriction of wearing short shirt which does not cover bottom is 92.5%. This is supported by the fact that the estimated true proportion of female ABC University who wish to abolish the restriction of wearing short shirt which does not cover bottom lies between 45.9% and 70.8% at 95% confidence level. Although this indicates that it is possible that less than 50% of the students wish to abolish the restriction, there is a greater chance that majority, which is more than 50%, of the female ABC University students wish to abolish the restriction as 50% lies near the lower end of the confidence interval while the confidence interval is towards the majority.
Therefore, we are 95% confident that the true proportion of the female ABC University students wish to abolish the restriction of wearing short shirt which does not cover bottom lies between 45.9% and 70.8% and that there is 92.5% chance that majority of the female ABC University students wish to abolish the restriction.
Restriction 2: Sleeves of shirt do not reach wrists
The Centre of a distribution
Binomial Distribution
X = Number of ABC University female students who wish to abolish the restriction of wearing shirt with sleeves not reaching wrists
Sample size, n = 60
Probability of success, p =
Probability of failure, q = 1 – p
= 1 – 0.567
= 0.433
Mean, μ = np
= 60(0.567)
= 34.02
≈ 34.0
Standard deviation, σ =
=
= 3.838
≈ 3.84
X ~ Bin (60, 0.567)
What is the probability that majority of the female ABC University students wish to abolish the restriction of wearing shirt with sleeves not reaching wrists?
Pr (x ≥ 30) = 1 – Pr (x ≤ 29)
= 1 – binomcdf( 60, 0.567, 29)
= 0.8802
≈ 0.880
Normal approximation
Sample size, n = 60 n ≥ 30
np = 60(0.567) = 34.02 np ≥ 10 conditions satisfied
nq = 60(0.433) = 25.98 nq ≥ 10
Mean, μ = 34.0
Standard deviation, σ = 3.84
What is the probability that majority of the female ABC University students wish to abolish the restriction of wearing shirt with sleeves not reaching wrists?
Pr (x ≥ 30) = Pr (x * ≥ 29.5)
=
= Pr (z ≥ - 1.172)
= normalcdf ( - 1.172, E99 )
= 0.879
Confidence Interval for a Proportion
To estimate the proportion of female ABC University students who wish to abolish the restriction of wearing shirt with sleeves not reaching wrists, a sample proportion is examined.
Sample size, n = 60
Number of success, x = 34
Sample proportion, =
=
= 0.567
= 1 –
= 1 – 0.567
= 0.433
Confidence level = 95 %
Confidence interval
0.441 < p < 0.692
We are 95% confident that the actual proportion of female ABC University who wish to abolish the restriction of wearing shirt with sleeves not reaching wrists lies between 44.1% and 69.2%.
The effect of increasing sample size, n on confidence interval
Consider samples of different size but all with p = 0.567 and q = 0.433 at 95% confidence level.
Sample size, n = 20
0.350 < p < 0.784
Sample size, n = 40
0.413 < p < 0.721
Sample size, n = 80
0.458 < p < 0.676
Sample size, n = 100
0.470 < p < 0.664
For various values of n we have:
We see that increasing the sample size, n produces confidence intervals for proportion of narrower width.
The effect of increasing confidence level on confidence interval
Consider different confidence level but all with p = 0.567 and q = 0.433 with sample size, n = 60.
Confidence level = 90%
0.462 < p < 0.672
Confidence level = 98%
0.418 < p < 0.716
Confidence level = 99%
0.402 < p < 0.732
For various values of confidence level, we have:
We see that increasing the confidence level produces wider confidence interval.
Conclusion
By using binomial distribution and normal approximation, we discover that the chance of majority of the female ABC University students who wish to abolish the restriction of wearing shirt with sleeves not reaching wrists is 88.0%. This is supported by the fact that the estimated true proportion of female ABC University who wish to abolish the restriction of wearing short shirt which does not cover bottom lies between 44.1% and 69.2% at 95% confidence level. Although this indicates that it is possible that less than 50% of the students wish to abolish the restriction, there is a greater chance that majority, which is more than 50%, of the female ABC University students wish to abolish the restriction as 50% lies near the lower end of the confidence interval while the confidence interval is towards the majority.
Therefore, we are 95% confident that the true proportion of the female ABC University students wish to abolish the restriction of wearing short shirt which does not cover bottom lies between 44.1% and 69.2% and that there is 88.0% chance that majority of the female ABC University students wish to abolish the restriction.
Restriction 3: Too tight pants
The Centre of a distribution
Binomial Distribution
X = Number of ABC University female students who wish to abolish the restriction of wearing too tight pants
Sample size, n = 60
Probability of success, p = 0.383
Probability of failure, q = 1 – p
= 1 – 0.383
= 0.617
Mean, μ = np
= 60(0.383)
= 22.98
≈ 23.0
Standard deviation, σ =
=
= 3.765
≈ 3.77
X ~ Bin (60, 0.383)
What is the probability that majority of the female ABC University students wish to abolish the restriction of wearing too tight pants?
Pr (x ≥ 30) = 1 – Pr (x ≤ 29)
= 1 – binomcdf( 60, 0.383, 29)
= 0.04305
≈ 0.0431
Normal approximation
Sample size, n = 60 n ≥ 30
np = 60(0.383) = 22.98 np ≥ 10 conditions satisfied
nq = 60(0.617) = 37.02 nq ≥ 10
Mean, μ = 23.0
Standard deviation, σ = 3.77
What is the probability that majority of the female ABC University students wish to abolish the restriction of wearing too tight pants?
Pr (x ≥ 30) = Pr ( x * ≥ 29.5)
=
= Pr (z ≥ 1.724)
= normalcdf ( - 1.724, E99 )
= 0.0424
Confidence Interval for a Proportion
To estimate the proportion of female ABC University students who wish to abolish the restriction of wearing too tight pants, a sample proportion is examined.
Sample size, n = 60
Number of success, x = 23
Sample proportion, =
=
= 0.383
= 1 –
= 1 – 0.567
= 0.617
Confidence level = 95 %
Confidence interval
0.260 < p < 0.506
We are 95% confident that the actual proportion of female ABC University who wish to abolish the restriction of wearing too tight pants lies between 26.0% and 50.6%.
The effect of increasing sample size, n on confidence interval
Consider samples of different size but all with p = 0.383 and q = 0.617 at 95% confidence level.
Sample size, n = 20
0.170 < p < 0.796
Sample size, n = 40
0.232 < p < 0.534
Sample size, n = 80
0.276 < p < 0.490
Sample size, n = 100
0.288 < p < 0.478
For various values of n we have:
We see that increasing the sample size, n produces confidence intervals for proportion of narrower width.
The effect of increasing confidence level on confidence interval
Consider different confidence level but all with p = 0.383 and q = 0.617 with sample size, n = 60.
Confidence level = 90%
0.280 < p < 0.486
Confidence level = 98%
0.237 < p < 0.529
Confidence level = 99%
0.221 < p < 0.545
For various values of confidence level, we have:
We see that increasing the confidence level produces wider confidence interval.
Conclusion
By using binomial distribution and normal approximation, we discover that the chance of majority of the female ABC University students who wish to abolish the restriction of wearing too tight pants is very small which is 4.31%. This is supported by the fact that the estimated true proportion of female ABC University who wish to abolish the restriction of wearing too tight pants lies between 26.0% and 50.6% at 95% confidence level. Although this indicates that it is possible that more than 50% of the students wish to abolish the restriction, there is a greater chance that minority, which is less than 50%, of the female ABC University students wish to abolish the restriction as 50% lies near the lower end of the confidence interval and the confidence interval is towards the minority.
Therefore, we are 95% confident that the true proportion of the female ABC University students wish to abolish the restriction of wearing too tight pants lies between 26.0% and 50.6% and that there is very small chance which is 4.31% that majority of the female ABC University students wish to abolish the restriction.
Restriction 4: Pants shorter than ankle length
The Centre of a distribution
Binomial Distribution
X = Number of ABC University female students who wish to abolish the restriction of wearing pants shorter than ankle length
Sample size, n = 60
Probability of success, p = = 0.300
Probability of failure, q = 1 – p
= 1 – 0.300
= 0.700
Mean, μ = np
= 60(0.300)
= 18.0
Standard deviation, σ =
=
= 3.549
≈ 3.55
X ~ Bin (60, 0.300)
What is the probability that majority of the female ABC University students wish to abolish the restriction of wearing pants shorter than ankle length?
Pr (x ≥ 30) = 1 – Pr (x ≤ 29)
= 1 – binomcdf( 60, 0.300, 29)
= 0.0009128
≈ 0.000913
Normal approximation
Sample size, n = 60 n ≥ 30
np = 60(0.300) = 18.0 np ≥ 10 conditions satisfied
nq = 60(0.700) = 42.0 nq ≥ 10
Mean, μ = 18.0
Standard deviation, σ = 3.55
What is the probability that majority of the female ABC University students wish to abolish the restriction of wearing pants shorter than ankle length?
Pr (x ≥ 30) = Pr (x * ≥ 29.5)
=
= Pr (z ≥ 3.239)
= normalcdf (3.239, E99)
= 0.0005998
Confidence Interval for a Proportion
To estimate the proportion of female ABC University students who wish to abolish the restriction of wearing pants shorter than ankle length, a sample proportion is examined.
Sample size, n = 60
Number of success, x = 18
Sample proportion, =
=
= 0.300
= 1 –
= 1 – 0.300
= 0.700
Confidence level = 95 %
Confidence interval
0.184 < p < 0.416
We are 95% confident that the actual proportion of female ABC University who wishes to abolish the restriction of wearing pants shorter than ankle length lies between 18.4% and 41.6%.
The effect of increasing sample size, n on confidence interval
Consider samples of different size but all with p = 0.300 and q = 0.700 at 95% confidence level.
Sample size, n = 20
0.0992 < p < 0.501
Sample size, n = 40
0.156 < p < 0.442
Sample size, n = 80
0.200 < p < 0.400
Sample size, n = 100
0.210 < p < 0.390
For various values of n we have:
We see that increasing the sample size, n produces confidence intervals for proportion of narrower width.
The effect of increasing confidence level on confidence interval
Consider different confidence level but all with p = 0.300 and q = 0.700 with sample size, n = 60.
Confidence level = 90%
0.203 < p < 0.397
Confidence level = 98%
0.162 < p < 0.438
Confidence level = 99%
0.148 < p < 0.452
For various values of confidence level, we have:
We see that increasing the confidence level produces wider confidence interval.
Conclusion
By using binomial distribution, we discover that the chance of majority of the female ABC University students who wish to abolish the restriction of wearing pants shorter than ankle length is 0.0913%. The normal approximation shows similar trend as calculated chance of majority of the female ABC University students who wish to abolish this restriction is 0.05998%. Both of the calculated value indicates that the chance of majority of the female ABC University students who wish to abolish this particular restriction is significantly small. This is supported by the fact that the estimated true proportion of female ABC University who wish to abolish the restriction of wearing pants shorter than ankle length lies between 18.4% and 41.6% at 95% confidence level. This indicates that it is impossible that more than 50% of the students wish to abolish the restriction as the confidence interval is towards the minority.
We are 95% confident that the true proportion of the female ABC University students wish to abolish the restriction of wearing pants shorter than ankle length lies between 18.4% and 41.6% and that there is very small chance that majority of the female ABC University students wish to abolish the restriction. Therefore, we can say that only minority of the female ABC University students wish to abolish the restriction of wearing pants shorter than ankle length.
Investigation 3: Number of restrictions that ABC UNIVERSITY female students wish to abolish
Frequency Histogram of number of restrictions that
ABC UNIVERSITY students wish to abolish
The Centre of a Distribution
The mean
The mean of a sample,
=
= 1.833
Check by graphic calculator,
The mean, = 1.833
The median
The median is the score
is the score = score
which is the average of the 30th and 31st score
=
= 1.5
The mode
The mode is the most frequently occurring data value. From the frequency distribution histogram, the mode is 1.
Relative Frequency Histogram of number of restrictions that
ABC UNIVERSITY female students wish to abolish
Spike plot:
Dots plot:
The Variability (Spread) of a Distribution
The Range
The range of a given set of data is the difference between the maximum (largest) and the minimum (smallest) data values.
The range = 4 – 0 = 4
The Interquartile Range
The interquartile range is the range of the middle half (50%) of the data.
Interquartile range = upper quartile – lower quartile
= middle value of the upper half – middle value of the lower half
= 3.5 - 0
= 3.5
Box-and-whisker plot
The Standard Deviation
The standard deviation is a more useful measure of spread than range and interquartile range. Standard deviation can be found from the average variation from the mean of all data values.
Standard deviation, s = = 1.5963
By graphic calculator,
Conclusion
From the data, we observe that there are 18 female students of ABC University do not wish to abolish any of the four restrictions, 12 female students wish to abolish one of the four restrictions, 7 female students wish to abolish two of the four restrictions, 8 students wish to abolish three of the four restrictions, and 15 students wish to abolish all of the restrictions. In other words, we can say that 18 female students from ABC University do not wish to abolish any of the four restrictions under investigation and 42 female students wish to abolish at least one restriction from the four restrictions.
This is maybe because most of the students think that the restrictions are not reasonable and should be abolished at least one of them.
Overall Conclusion
In analysing the number of summonses received by students for centre distribution, it was found out that the average mean of summonses received by a student is 1.52. In addition, the median was 0 and the mode was 0 as well. Therefore, it showed that the majority of the students received 0 summon during the period of June 2005 to June 2006.
As a result, the distribution of the data was concentrated at the site where students received 0 summon. This may be due to the religion background of the students. Since the number of students who received 4 summonses and more was very small, the distribution was skewed to the right. This can also be clearly seen on the dots plot and frequency distribution histogram.
Among all the restrictions, the restriction of wearing short shirt which does not cover bottom had the largest proportion of female ABC UNIVERSITY students who wish to abolish this restriction. This maybe because the length of most of the blouses and shirts in the market do not cover bottom causing the students to have difficulty buying shirts that comply with the rules. Hence, the female students have no other options but to wear sweaters or jackets which are lengthy to prevent from getting summonses. This in turn becomes another reason for intending to abolish the restriction as the hot and humid weather in Malaysia is not suitable for this warm attire.
The second restriction most opposed by the female ABC UNIVERSITY students is the restriction of wearing shirts with sleeves do not reach wrists. This is again due to the inappropriateness of wearing shirts with long sleeves in the hot weather condition of Malaysia. The students may think that this restriction is impractical.
On the contrary, only a small proportion of female ABC UNIVERSITY students intend to abolish the restriction of wearing pants which are too tight and shorter than ankle length. This maybe because these restrictions are reasonable and that they can be obeyed without much inconveniences.
From our study, we found out that there were only a few students who received summonses from the period June 2005 to June 2006. This indicates that most student abide to the regulations of attire. However, most of the ABC University female students think that the restrictions imposed on them should be abolished. This shows that the students comply with the rules despite the fact that they are not satisfied with the restrictions.
In conclusion, there are several suggestions that can be made to rectify the current situation. Firstly, all the restrictions should be imposed on students within the ABC UNIVERSITY compound only. This is because proper dress code is vital in educational institutions to show respect to the lecturers and the school itself. However, students should be allowed to wear casual attire and should not be bound to the restrictions during after school hours as long as the students are not scantily clad.