The mean of the share prices is higher than its median, which indicates right-skewness. It means that most of the values are in the lower portion of the distribution. This distortion is caused by some extremely large values in the sample. The maximum of the sample is 32.9 and the minimum is 17.89 (see table above.) The positive skewness means that the distribution is right-skewed and that most values cluster around the lower portion with the exception of some large values. These large values pull the mean upward so that the mean is greater than the median. The negative kurtosis means that the distribution is “flat.” The standard deviation is similar compared to Johnson and Johnson’s shares in this report, but Hewlett Packard’s share price has been fluctuated a little bit. General speaking, Hewlett Packard’s share price has been relatively stable during the period with a hint of future increases.
American Express
Compared to Hewlett Packard, American Express doesn’t fluctuate as much as Hewlett Packard. Again it fluctuates a little bit from the period 31/12/2003 until a quite low point 44.9666 on 31/03/2005. Then the share price begins to peak up and continuously grow until the highest mark 54.36 during the month of 31/05/2006.
The negative kurtosis again indicates flatness of the distribution, which means that no recurring values or clustering around the mean. The standard deviation is small compared to other shares in this report, which indicates that American Express share price has been relatively stable during the period. This can be enforced by the Range (12.142) which is the lowest compared to other shares.
Q2 Compute all the linear correlation coefficients between the series
Since there are three shares data, there will be three sets of correlation coefficients: one between Johnson & Johnson and Hewlett Packard, between Johnson & Johnson and American Express, and between Hewlett Packard and American express. We will look at each correlation separately, and then we will compare the three shares together.
The coefficient of correlation measures the relative strength of a linear relationship between two numerical variables.
Johnson & Johnson and Hewlett Packard
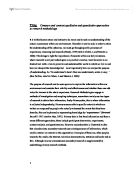
The linear relationship between Johnson & Johnson and Hewlett Packard is 0.041(corrected to three significant digits), which means that there is little linear relationship existed. If I draw a graph with Johnson & Johnson’s share price against Hewlett Packard, it would look like that:
It should be noted that they are positively correlated. Those share prices with the highest price from Johnson & Johnson tend to be associated with the highest of Hewlett Packard’s share price. However, this relationship is weak, as indicated by a coefficient of correlation of 0.041.
Johnson & Johnson and American Express
The correlation between Johnson & Johnson and American Express is 0.26. This means that the two shares are slightly correlated, but not overly so. In fact, if you plot Johnson & Johnson against American Express, you barely notice the correlation. .
Hewlett Packard and American Express
The correlation between Hewlett Packard and American Express is 0.863, which means that they are highly positive correlated. Holding these two shares together as a portfolio will not diversify the risk. Instead you magnify the risks. It’s like you put not only one, but two eggs in the same basket. (The idea of diversification is not put all the eggs in the same basket.) Below is the graph shows Hewlett Packard against American Express would look like.
Therefore, even though Johnson & Johnson and Hewlett Packard are not exactly compatible portfolio wise (If so, the coefficient correlation should be negative), they still make a fairly okay portfolio.
In summary, the coefficient of correlation indicates the linear relationship, or association, between two share prices. When the coefficient of correlation gets closer to +1 or -1, the linear relationship between the two share prices is stronger. When the coefficient of correlation is near 0, little or no linear relationship exists. The sign of the coefficient of correlation indicates whether the data are positively correlated or negatively correlated. The existence of a strong correlation does not imply a causation effect. It only indicates the tendencies present in the data.
Below I have put together all the three share prices during the period:
Compared to Johnson and Johnson, we can see that Hewlett Packard and American Express are more stabilized in terms of its fluctuation. Johnson’s share price has increased during the middle period of the 30 months, and then there is downward trend. However, at the end of the 30 month, Johnson share price did pick up. We can see Hewlett Packard and American Express have an almost identical trace along the period, once again proving the very positive correlation. Johnson & Johnson’s is less, but still positively, correlated to the two shares. The three shares peak approximately in the different period. While Johnson and Johnson at its highest mark, Hewlett Packard and American Express are in a decline trend.
Q3 Financial Advice on Hold, buy and sell.
Actual return on an investment may differ substantially from your expected return. If we say that risk as the variability of returns from those that are expected, therefore the greater the variability, the riskier the security is said to be.
A meaningful diversification is combine securities in a way that will reduce risk, for example the portfolio of Johnson & Johnson and Hewlett Packard. The relationship between Johnson& Johnson and Hewlett is weak, as indicated by a coefficient of correlation of 0.041. Therefore, even though Johnson & Johnson and Hewlett Packard are not exactly compatible portfolio wise (If so, the coefficient correlation should be negative), they still make a fairly okay portfolio.
The greater the standard deviation of returns, the greater the variability of returns, and the greater the risk of the investment. Apply this to the 3 stocks; both Johnson & Johnson and Hewlett Packard’s standard deviation are bigger than the American Express share, meaning greater risk of investment compared to American Express. However, we can not only look at it’s variability but also at its volatility and its fluctuation. (I have considered these two at below)
To conclude, I would suggest “hold” the Hewlett Packard’s shares until end of 2006, as from the graph of Hewlett Packard the trend is going up steadily, therefore the last highest mark 32.9 may not be the highest mark. At the end of 2006, I would suggest sell the Hewlett Packard’s shares because at this point the shares probably have reached it’s highest point, and there after the shares are likely going down. So hold any longer may result in losing the value of the share.
I would suggest “buying” more shares of Johnson & Johnson, though it has just been to a decline, but the share price is just start to rise from 31/01/2006. Therefore buying the share at this time is relatively cheap and we can wait for increases in the future, where Johnson & Johnson’s graph clearly indicates the increasing trend. In addition, Johnson and Johnson’s share price has been pretty stable all along. We can also say that Johnson and Johnson’s share as a fairly secure stock.
For American express I would suggest to “sell” the share because its share is now at its highest point (concluded from the American Express graph). So it’s wise to sell it now. In addition, information from London exchange market indicates that American express’s shares are decreasing from June 2006 to September 2006, a little increase from September to December 2006, afterward it towards decreasing direction. Generally in 2007, American express is the weakest stocks in the Dow Jones industrial.
Moreover, I would also like to consider the possibility of share portfolio. As I have indicated before Johnson & Johnson and Hewlett Packard make a fairly okay portfolio.
Bibliography
Books
-
Mark L. Berenson, et al., “Basic Business Statistics” (New Jersey: Pearson Prentice Hall, 2004), 89.
-
James C. Van Horne and John M. Wachowicz “Fundamentals of Financial Management” twelfth edition (Pearson Prentice Hall, 2003)
Websites
-
Engineering Statistics Handbook [on-line]; available from ; Internet; accessed 17th of April 2007.
-
Engineering Statistics Handbook, available from
; Internet;
Accessed 18th of April 2007
http://www.ft.com/cms/s/0/57756d66-0021-11dd-825a-000077b07658.html
Engineering Statistics Handbook [on-line]; available from ; Internet; accessed 19April 2007.
Mark L. Berenson, et al., Basic Business Statistics (New Jersey: Pearson Prentice Hall, 2004), 89.
Engineering Statistics Handbook, .