=
= 40.56
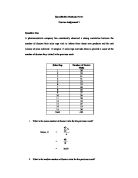
Median Group Region B = value at observation
= value at observation
= value at observation 48th
= within group
Median for Region B =
=
= 41.50
- Calculate the variance and standard deviation of the clients’ age in each region
Variance, σ2 = 265.245
Standard Deviation, σ =
=
= 16.286
Variance, σ2 = 315.997
Standard Deviation, σ =
=
= 17.776
-
Calculate the 25th and 75th percentile of the clients’ age for each region.
25th percentile for Region A = value at observation 0.25 × (nA + 1)
= value at observation 0.25 × 96
= value at position 24
(within the 25 – 34.99 class interval)
=
= 30.594
75th percentile for Region A = value at observation 0.75 × (nA + 1)
= value at observation 72
(within the 50 – 64.99 class interval)
=
= 51.999
25th percentile for Region B = value at observation 0.25 × (nB + 1)
= value at observation 24
(within the 25 – 34.99 class interval)
=
= 29.496
75th percentile for Region B = value at observation 0.75 × (nB + 1)
= value at observation 72
(within the 50 – 64.99 class interval)
=
= 55.247
-
The firm is considering a special marketing campaign for younger clients if the 25th percentile value is less than 30. Based on the calculations above, should they undertake this campaign in either region?
The firm should only undertake the marketing campaign in Region B because the 25th Percentile of this region is 29.50, which is less than 30. However, the 25th Percentile for Region A is 30.59 which is higher than 30. Therefore the campaign will not be required for Region A.
Question Three
A professor teaching Quantitative Methods thinks his is class is performing significantly above average. Historically the grades have been normally distributed with a mean 65 with a standard deviation of 20. He takes a random sample of 30 students in the class and determines that they have a mean score of 69.
- Set up the null and alternative hypothesis for this test.
H0: μ = 65
H1: μ > 65
- What is the critical value against which the test statistic will be compared? Explain why you chose this value.
Testing at a 5% significance level for a one-sided test and also a degree of freedom, df = 30 – 1 = 29, the critical value of t = 1.699.
- Conduct a statistical test at the 5% level to show if the professor’s hypothesis is true?
= 65
n = 30
= 69
s = 20
t =
=
= 1.096
1.095 < 1.699. The test statistic is lower than the critical value. Therefore, we cannot reject the Null Hypothesis. It cannot be indicated if the mean score is higher at 69 as stated by the QM professor. .
- If the population standard deviation had been 15, would this change your conclusion?
t =
=
= 1.461
1.461 < 1.699. The test statistic is still lower than the critical value. Therefore, we cannot reject the Null Hypothesis and the conclusion remains the same.
- Discuss the implications of changing sample size in hypothesis testing.
Taking two the sample sizes, n1 = 21 and n2 = 121.
For n1, testing at a significance level of 5% level and a df = 21 - 1 = 20, the critical value of t = 1.725
t =
=
= 1.193
1.193 < 1.725. The test statistic is lower than the critical value. Therefore, we cannot reject the Null Hypothesis. It cannot be indicated if the mean score is higher at 69 as stated by the QM professor.
For n2, testing at a significance level of 5% level and a df = 121 - 1 = 120, the critical value of t = 1.658
t =
=
= 2.191
2.191 > 1.725. The test statistic is higher than the critical value. Therefore, we can reject the Null Hypothesis in favour of the alternative. This indicated that the mean score is higher at 69 as stated by the QM professor.
The analysis above shows that if the sample size is higher, the test statistic value will be higher as well. This creates a higher chance of rejecting the Null Hypothesis (H0). Likewise, if the sample size was smaller, than the value of the test statistic will be lower too. Therefore, there is a much lower chance of the hypothesis being rejected. This goes to show if the mean score of 69 is based on 121 students instead of 30 students, then there is a higher chance that the view of the QM professor is proved right.
When the mean is calculated based on a bigger population, there is less variability affecting the mean which makes it more reliable. This also makes the the confidence intervals smaller. Furthermore, the Central Limit Theorem (CLT) demonstrates that as samples get larger, they increasingly resemble that of the population.
Question Four
A Customer Services Department is concerned about low levels of customer satisfaction. They survey regular, semi-regular and infrequent customers and each can indicate that they are ‘Satisfied’, ‘Unsure’ or ‘Dissatisfied’ with the level of customer service they are receiving. The results are below:
Using an appropriate statistical test, demonstrate whether or not there is an association between type of client and satisfaction with customer service.
H0: There is no association between the type of client and satisfaction with customer.
H1: There is an association between the type of client and satisfaction with customer service
Test at a 5% level of significance
Degree of freedom, df = (number of rows – 1) × (number of column -1)
= (3 – 1) × (3 – 1)
= 4
The critical value from the Chi-square table = 9.49
Computing test statistic for expected values
Expected value, E =
Expected value for ‘regular’ customers who are satisfied =
= 22.50
Expected value for ‘regular’ customers who are unsure =
= 12.6563
Expected value for ‘regular’ customers who are dissatisfied =
= 9.84
Expected value for ‘semi-regular’ customers who are satisfied =
= 27.50
Expected value for ‘semi-regular’ customers who are unsure =
= 15.47
Expected value for ‘semi-regular’ customers who are dissatisfied =
= 12.03
Expected value for ‘infrequent’ customer who are satisfied =
= 30.00
Expected value for ‘infrequent’ customers who are unsure =
= 16.88
Expected value for ‘infrequent’ customers who are dissatisfied =
= 13.13
The test statistic from the Chi-square score is 3.10
3.10 < 9.49. The test statistic from the Chi-square table is lower than the critical value. Therefore, the Null Hypothesis is accepted. This means that there is no association between the type of client and satisfaction with customer service.
Question Five
Part A
A university relies on its faculty to provide course advice to its students regarding their course selection and degree progress. Unfortunately, faculty are not terribly good at this and give students incorrect advice 20% of the time, resulting in errors. In an audit, 15 registration forms are selected.
- What is the probability that none of the forms contain errors?
P (0) = 0.815
= 0.0352
- What is the probability that 3 or fewer of the forms contain errors?
P (3 or fewer) = P (0) + P (1) + P (2) + P (3)
= 0.0352 + 0.1319 + 0.2309 + 0.2501
= 0.6481
- What is the probability that 4 or more of the forms contain errors?
P (4 or more) = 1- P (3 or fewer)
= 1 - 0.6481
= 0.3519
Part B
A website receives, on average, 120, ‘hits’ per hour.
- What is the probability that it receives no ‘hits’ for a given two minute interval?
λ = average number of hits per 2 minutes = = 4
P (0) =
=
= 0.0183
- What is the probability that it receives exactly 3 ‘hits’ for a given two minute interval?
P (3) =
=
= 0.1954
- What is the probability that it receives 3 or more ‘hits’ for a given two minute interval?
P (1) =
=
= 0.0732
P (2) =
=
= 0.1465
P (3 or more) = 1 – P (0) – P (1) – P (2)
= 1 – 0.0183 – 0.0732 – 0.1465
= 0.7620
Question Six
A market research firm polls consumers in a particular community to examine whether individuals responded favourably to a recent advertising campaign. They sample 1000 individuals and 630 indicate that they were favourable to this campaign.
- Construct a 95% confidence interval of favourable responses.
n = 1000
X = 630
Sample proportion, p =
=
= 0.63
With a 95% confidence interval, z = ±1.96
Proportion which responded favourably
=
=
= 0.63 ± 0.0299
0.6001 < Proportion who responded favourably < 0.6599.
The number of consumers that were favourable to the advertising campaign is in the range of 600 to 660 at a confidence interval of 95%
- The campaign will be considered a success (and used in other communities) if it can be demonstrated that at least 60% of respondents are favourable to the campaign. Conduct a statistical test at the 5% level to determine whether the campaign should be used in other communities.
H0: p < 0.6
H1: p ≥ 0.6
Testing at a significance level of 5% and since this is a one-sided test, the critical value of t = 1.645
z =
=
=
= 1.935
1.935 > 1.645. The test statistic is larger than the critical value. Therefore, the Null Hypothesis is rejected in favour of the alternative. This suggests that at least 60% of the respondents are favourable to the recent advertising campaign and it should be used in the other communities.
- Comment on whether you think this test should be 1-sided or 2-sided.
This test should be one-sided as we are looking at whether the test statistic is greater or less than an expected value, which for this case is 60% of the respondents, rather than the difference from a particular hypothesized value.
Question Seven
A recent survey of top executives finds that on average, CEOs and Managing Directors spend 5.2 hours per week (standard deviation = 3.5) engaged in their firms charitable activities and other activities to promote corporate social responsibility. There were 30 respondents in this sample.
- Calculate a 95% confidence interval for hours spent in these activities.
n = 30
= 5.2
s = 3.5
Degree of freedom, df = n – 1
= 30 – 1 = 29
With a 95% confidence interval and df = 29, the critical value of t = ± 2.045
μ =
=
= 5.2 ± 1.3067
3.8933 ≤ μ ≤ 6.507
The population mean will lie between 3.89 hours and 6.51 hours at a 95% confidence interval.
- Historically it is generally been accepted that top executives should spend a minimum of 4.5 hours per week engaged in these activities. Do the sample data indicate that this figure has changed? Conduct a hypothesis test to support your answer.
H0: μ ≥ 4.5
H1: μ < 4.5
Testing at a significance level of 5%, df = 29 and being a one-sided test, the critical value of t = 1.699.
. t =
=
= 1.095
1.095 < 1.699. The test statistic is lower than the critical value. Therefore, we cannot reject the Null Hypothesis. We cannot indicate if the sample data has changed.
Question Eight
It has been hypothesized that males and females pay different prices for haircuts. To investigate this crucial issue, a survey is conducted to a sample of males and females. They provide you with the following data
- Calculate a 95% confidence interval for female haircut price.
= $29.78
s = 10.21
n = 25
Degree of freedom, df = 25 – 1 = 24
A confidence interval of 95% and df = 24, the critical value of t = 2.064
μ =
=
= 29.78 ± 4.21
= 25.57 ≤ μ ≤ 33.99
The female hair cut price should lie between $25.50 and $34.00 at a 95% confidence interval.
- Calculate a 95% confidence interval for male haircut price.
= $22.54
s = 7.76
n = 20
Degree of freedom, df = 20 – 1 = 19
With a confidence interval of 95% and df = 19, the critical value of t = 2.093
μ =
=
= 22.54 ± 3.63
= 18.91 ≤ μ ≤ 26.17
The male hair cut price should lie between $18.90 and $26.20 at a 95% confidence interval.
- Historically, males have paid, on average, $20 for a hair cut. Does the sample evidence suggest that this amount is increasing (test at a 5% significance level)?
H0: μ = 20
H1: μ >20
= 20
n = 20
= 22.54
s = 7.76
Testing at a significance level of 5%, df = 19 and being a one-sided test, the critical value of t = 1.729.
t =
=
= 1.4638
1.4638 < 1.729. The test statistic is lower than the critical value. Therefore, we cannot reject the Null Hypothesis. The sample data does not indicate if the price for male hair cuts is increasing.
- Conduct a statistical test to determine (at a 5% level of significance) if males and females play different prices for haircuts.
H0: μf – μm = 0
H1: μf – μm ≠ 0
Degree of freedom, df = nf + nm – 2
= 25 + 20 – 2
= 43
Testing at a significance level of 5% and df = 43, the critical value of t = 2.018
Pooled standard error, sp =
=
= 9.2082
t =
=
= 2.6208
2.6208 > 2.018. The test statistic is greater than the critical value. Therefore, we can reject the Null Hypothesis in favour of the alternative. The sample data does not indicate if the price for male hair cuts is increasing. This indicates that statistically, males and females pay different prices for haircuts.
Question Nine
Part A
A health authority is concerned about the waiting times at emergency rooms in hospitals. The authority intends to conduct a statistical test on this. What sample size would be required to estimate the true (population) within a bound of 10 minutes, at a 95% confidence level? The population standard deviation is known to be 20 minutes.
Taking a confidence level of 95%,
z = 1.96
σ = 20
e = 10
n =
=
= 15.3664
A sample of 16 would need to be drawn to ensure the variation of no greater than ±10 minutes from the mean.
Part B
A polling firm has been hired to find out whether citizens support a particular policy initiative. If they want to be accurate within a range of +/- 3.5% at a 95% level of confidence, how many individuals would they need to survey?
Taking a confidence level of 95%,
z = 1.96
e = 0.035
Since we have not given any further information on p, it is assumed to be 0.5
n =
=
= 784
A sample of 784 individuals would need to be drawn to ensure the accuracy is within a range of ±3.5% from the population mean.