Experiment A:
Chanalyzer
After inserting the ‘dongle’ in the USB port and running the Chanalyzer u will be able to see several access points and channels which match with those found using Netstumbler.
Access Points and Channels as seen in Network stumbler
Chanalyzer provides three different views to guide us manage issues with Wi-Fi networks:
-
Spectral View: depicts bandwidth use over time with a graph that plots the time period chosen against the range of frequencies, with each point colour-coded where red is high and blue is low.
-
Topographic View: A map that shows the popularity of frequency/amplitude over a selected time period.
-
Planar View: Displays current, average and maximum amplitudes – of amplitude Vs frequency, which help us analyse the channels that are open for usage and channels that are already being used to the maximum.
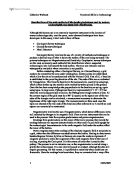
The figure below shows the readings of average strengths for the frequencies 2442, 2457 and 2462 for corresponding channels of 7, 10 and 11.
For channel 7 and 11
For channel 10
These are the recordings of MW radiation from other sources
From the microwave recordings we can see that amplitudes over time for each frequency in spectral view. And in topographic view the popularity of amplitude/frequency are being displayed.
The planar view shows amplitude over frequency. The yellow line shows current amplitude, green average amplitude and blue shows the maximum amplitude.
From the above figure we can see that the channels 1, 6 and 10 very much active as they have maximum amplitude.
The report contains a synopsis of each channel and a grade. The grade is a rating of how silent a channel is; the higher the grade more silent the channel is. In this case for example channel 1 and 2 are the quietest channel. The report can be ordered by clicking on any column header.
Experiment B:
iPAQ
Switch on the iPAQ and follow the procedure below.
To view the signal strength between your HP iPAQ and an access point
Wi-Fi connection:
1. Tap the Connections icon in the Navigation bar.
2. When the Connectivity box displays, you will be able to view
the type of network the HP iPAQ is connected to (for example,
Work or Internet) and an icon displaying the signal strength.
NOTE: The Signal Strength icon will not be displayed if a connection
is not present.
3. To make changes to the connection settings, tap Settings.
4. To exit the Connectivity box, tap the Hide button.
For more detailed information:
1. Tap Start > iPAQ Wireless.
2. Tap the Wi-Fi icon to turn Wi-Fi on.
3. Tap the Manager button.
4. If a wireless connection has been established, you can view
information on signal strength, SSID, Encryption Status, Access
Point, and IP Address.
5. To add a new wireless network, tap the Configure Wireless
Networks button.
6. For more detailed information on your connection status, tap the
Advanced tab.
From the above table we can deduce that ‘Freepublic Wi-Fi’ has more signal strength outside the lab and near the lift and in the lab ‘Hpsetup’.
Conclusion:
When setting up an office or any wireless network for that matter the locations of the access points should be of utmost importance as it forms the basis of terming a network as poor, average, good or of the best quality. Chanalyzer and iPAQ help us achieve these with a great user interface and make the whole task easy.