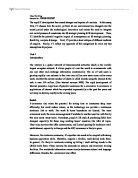
Figure 1: The “Australian” beach state model based after Wright and Short (1983, 1984).
[Source: Australian Surface Environments and Landforms Lab Manual, 2005]
Once the classification of the beaches was made the numerical dimensionless fall velocity (Ω) also defined by Wright and Short (1984) was assigned in order to provide a simple quantification of the observed morphological states.
Offshore wave characteristics such as significant wave height (Hs), significant wave period (Tp) and wave direction were provided via webCT. This data was obtained from a directional wave rider located at Long Reef, approximately 1km offshore at a depth of 80m (Ramasinghe et al., 2004). These characteristics were used to compare the results of the visual observation. They were also used to calculate the dimensionless fall velocity for further comparison.
RESULTS
As seen in Figure 2, swell waves were present throughout the study period from the east to south east.
Figure 2: Average daily wave direction for the study period.
The average daily wave height (Hs) recorded by the offshore wave rider varied between 1 and 4m. As demonstrated in Figure 3 wave heights began to increase on 4/03/01 March indicating the onset of a storm, with offshore wave heights peaking between the 5/03/01 and 9/03/01 during what can be assumed to be a storm event. Following the storm event the offshore wave height decreased rapidly and remained relatively constant after 14/03/01.
Figure 3: Average daily significant wave height (Hs) for the study period.
The peak wave period (Tp) varied from 6 to 13 s as shown in Figure 4. In general the wave period increased with the storm event, however the highest peak occurred on 30/03/01 indicating a rise in wave speed which may influence a change in the morphological structure of the nearshore zone.
Figure 4: Average daily peak wave period (Tp) for the study period.
The dimensionless fall velocity (Ω) calculated using the average daily wave height (Hs) was higher than the values of Ω determined by classifying the beach via observation. As shown in Figure 5 however, both values of Ω tended to follow the same general pattern.
Figure 5: Dimensionless Fall Velocity (Ω) for study period calculated using Hs and predicted via observation using model prediction by Wright and Short (1984).
As outlined in Table 1, the beach morphology altered considerably throughout the study period. A rhythmic bar and beach system was apparent from 1/03/01 to 3/03/01. This system began to transform into a transverse bar and rip on the 4/03/01 however this transforming bar system was completely wiped out during an apparent storm event indicated by the dissipative conditions. Longshore bar -trough morphology began to develop on 9/03/01 and was well developed by 11/03/01. Reflective conditions can be seen from 14/03/01 and it appears as though the beach state shifts between longshore bar-trough and reflective over the following two weeks.
Table 1: Summary of morphological beach states of study period including features present.
DISCUSSION
As only a single series of observations have been used in this study there is a limitation to the accuracy of defining the beach in a more broad sense. There is also the limitation of the data used with the direction of sediment transport being inferred based only on visual observations of the beach morphology.
The dimensionless fall velocity (Ω) values calculated from the data obtained by the offshore wave rider over predict the ideal values of Ω according to the Wright and Short (1984) model. This is due to the offshore location of the equipment and the use of significant wave height (Hs) as opposed to the breaking wave height (Hb). Obtaining nearshore wave characteristics is difficult due to the logistical complications of maintaining in-situ instruments in the nearshore environment where bed changes can alternately scour or bury sensors (Ramasinghe et al., 2004). The only reported field experiment done to address this was reported by Brander (1999). As shown in Figure 5 however, the Ω values calculated using offshore data still tend to follow the same trend as the Ω values inferred when classifying the beach via visual observation. This would suggest that offshore data is useful enough to infer beach state conditions without entering into the difficulties of nearshore data measurement.
When observing the morphological states of Palm Beach, there was a notable difference in the progression of states compared with the Wright and Short (1984) model. Although the beach moved directly from dissipative to longshore trough-bar after the apparent storm event, as suggested by the model, further migration of the bar and the ultimate progression through intermediate beach states cannot be seen upon observation of the photos alone. From 10/03/01 to 13/03/01 the beach appeared to be in the state of longshore bar-trough, however this was immediately followed by a reflective state on 14/03/01. Over the following two weeks it appears as though the beach morphology shifted between the states of longshore bar-trough and reflective, and although not obvious in all photos, it appears that the beach is in a reflective state at high tide, and a longshore bar-trough state at low tide. The reflective state is consistent with the low wave heights observed, while the photos indicate presence of a longshore bar over this period. With low wave heights and period over this time the change in the bar shape would be minimal. As the wave period influences the speed of the wave, the height and of period the waves are simply not significant enough to shift the bar.
On 28/03/01 there was an increase in both wave heights and period suggesting that the morphological structure of the beach may progress into a rhythmic bar and beach, however further studies of the beach would need to be done to confirm this.
CONCLUSIONS
The morphological changes of beaches are directly influenced by wave height, direction and period, which are the dominant forces of sediment movement within the nearshore zone. The various stages of the Wright and Short (1984) model can be identified at Palm Beach however the notable differences between the progression of the stages suggest it is an unusual beach system. This was also recorded by Hoffman (1982) who observed that this beach system was exposed to a high energy, deep-water wave climate, with minimal inshore wave height reduction by bottom friction due to the narrow continental shelf and steep nearshore zone.
REFERENCES
Coastal Imaging Lab, 2005. [http://cil-www.oce.orst.edu:8080/], accessed 28th April,
2005
Brander, R.W., 1999. Field observations on the morphodynamic evolution of a low-
energy rip current system, Marine Geology, 157: 199-217
Hoffman, J.G., 1982. Palm Beach: Beach Erosion and Management Study, Public
Works Department (Coastal Branch), NSW
Ramasinghe, R., Symonds, G., Black, K., Holman, R., 2004. Morphodynamics of
intermediate beaches: a video imaging and numerical modeling study, Coastal Engineering, 51(7): 629-655
Wright, L.D., and Short, A.D., 1984. Morphodynamic variability of surf zones and
beaches, Marine Geology, 56: 93-118
APPENDICES
Appendix I: Images of Palm Beach 1/03/01 – 30/03/01