The stimulus for the cardiac cycle is initiated by a group of cardiac cells called the sino-atrial node (SA node) The SA node is also known as the pacemaker and determines the basic heart rate.
Measuring the subjects heart rate using the ECG. The ECG measures the electrical impulses that are given out from the heart tissue; with these impulses it is possible to measure a subjects heart rate.
Health and Safety. Laboratories have their own health and safety regulations. It is extremely important to follow these rules, failure to do so could result in accidents and injuries.
Aims
The aim of the experiment was to investigate and measure the subjects blood pressure,
heart rate in a safe manner, whilst getting a basic overview of the laboratories.
Method
Measuring the subjects blood pressure
- The subject must fully uncover one arm before the cuff is wrapped round.
- The arm should be fully extended at the elbow joint with the forearm supinated; the arm of the subject should give enough support to hold their own arm steady.
- The person taking the reading should locate the pulse of the brachial artery (this can be located inside the elbow) being careful not to make the subject feel too uncomfortable by applying too much pressure.
- Wrap the cuff fully around the upper arm of the subject with the marked area over the artery (being careful not to wrap it too tight that it cuts off the blood supply).
- Relocate subjects brachial artery pulse.
- Pump the cuff up to a pressure of about 200mmHg.
- Release the valve on the cuff gradually.
- When the pulse returns in the brachial artery, make a note of the pressure (this is the systolic pressure)
- Repeat the release of the valve of the cuff, but this time watch the mercury in the monometer rather than feel for the pulse.
- When you see oscillations of the mercury in the monometer, note down the pressure (this is the diastolic pressure)
- Then you have your two values, systolic, which is the top figure and diastolic, which is the bottom figure.
Safety Aspects
- Do not leave the cuff inflated on the subject for periods over 2 minutes.
- If the subject experiences pain at any point through the experiment, stop immediately.
- Allow at least 3 minutes rest on the same arm between re-inflation of the cuff.
Hint
- The average healthy humans blood pressure is apparently 120/80 (Systolic/diastolic)
Measuring the subjects heart rate
- Make the subject clean the bony parts of the left and right wrist and ankles with alcohol prior to the application of the electrode.
- Un-peal the electrode coverings.
- Firmly press the uncovered electrodes to the cleaned wrists and ankles (sticky side down)
- Attach the EPIC connector cables to the electrodes;
- Bottom left attaches to the left ankle.
- Bottom right attaches to the right ankle.
- Top left attaches to the left wrist.
- Top right attaches to the right wrist.
- The subject must sit still and relax if best results are wanted.
- Make sure the EPIC settings are:-
- Input1: 100Uv/div, 250mHz, 20Hz
- Time base: 200msec/div, Immediate
- Display mode: Normal
- If these settings are not the same as these on the screen, use the arrow keys to adjust.
- Press space bar to start a recording.
- You will see a trace appear, which you may recognize as an ECG trace.
Three aspects of the ECG are very important areas of the cardiac function, the P wave, the QRS complex and the T wave. The P wave represents atrial depolarization and occurs when the electrical impulses travel from the SA node to the AV node. The QRS complex represents ventricular depolarization and occurs as the purkinje fibers and ventricles and the T wave represents ventricular repolarisation.
Results
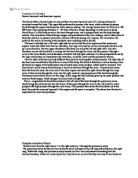
Graph 1
Graph 2
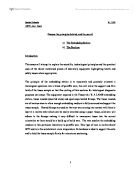
Graph 3
Graph 1 and 2 show the systolic and diastolic results of the class, split into males and females so it is clearer to make comparisons between them. Graph 3 shows the heart rate of the boys and girls on one graph.
Discussion
From graph 1 and 2 I can clearly see that the males have a higher systolic reading than the females. The reason for this could be due to body mass, exercise prior to the experiment or due to the amount of toxins are in the body, may it be from excessive drinking or drugs? All these are valid reasons.
Graph 3 is not as clear as the other two to draw conclusions from but it still shows that the female HR is lower than the males. The maximum HR of the females was 90, whereas for the males it was 105. The minimum HR for the females was 43 whereas for the males it was 50. The reason why the difference is probably personal reasons such as some may be more excited or restless than others at the time of the reading.
I conclude that all the experiments that took place went well. We collected all the data that we intended to and from that data we were able to analyze it critically and come up with conclusions. We also gained experience and knowledge about all the equipment and the lab whilst recording these experiments.
Maybe some results weren’t very accurate i.e. 90/30 for systolic/diastolic, but this could only be down to human error for a first attempt of reading the BP, because with all of us being fairly fit individuals, this surly must be wrong.
In my final conclusion I conclude that from the results on the day it seems that the female results make them healthier having a lower average in every experiment.