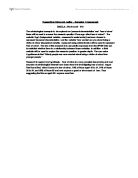
The frequency table shows that 35.3% of people are ‘worried’ about being a victim of crime, and 64.7% are ‘not worried’. Therefore, 29.4% more people are ‘not worried’ about being a victim of crime than ‘worried’.
Bivariate Analysis
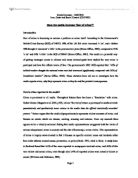
The crosstabulation shows that a greater amount of people aged 16-54 (36.8%) are worried about being a victim of crime, than people aged 55+ (33.2%). Also fewer people aged 16-54(63.2%) are not worried, than people who are 55+ (66.8%).
This does not support my hypothesis that ‘elderly people will be more worried about being a victim of crime than younger people’, it shows the complete opposite that, younger people are more worried.
As the variables were made dichotomous, the phi coefficient will be used to analyse the relationship between them.
The correlation coefficient shows that there is a weak, positive association between age and how worried you are about being a victim of crime. This is because the zero order correlation coefficient is 0.037, which is weak. As it is a weak association and using my crosstabulation I can see that this does not support my hypotheses.
Multivariate Analysis
The variable “main crime victim experienced” was first chosen to be the third variable. However this variable was not very significant. (See Appendix 1)
Therefore the variable “victim or not victim” was chosen as the third variable, in order to test if being a victim of crime in the past would affect the relationship between age and fear of crime.
Many studies have examined whether or not past experiences of crime has any effect on fear levels. The Angus Reid Report (1997) found that while 19% of non-victims express a great or fair amount of fear of being a victim of crime, 30% of victims express this fear.
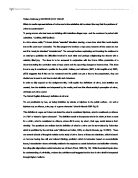
This frequency table shows more people who took part in this survey were non-victims (74.8%), than people who were victims (25.2%)
When looking at victims, 47.1% of victims aged 16-64 were worried about being a victim of crime, compared to 49.8% of victims aged 55+. This shows victims aged 55+ are more worried about being a victim of crime than victims aged 16-54.
When looking at non-victims, 31.7% of 16-54 years olds were worried about being a victim of crime, compare to 30.3% of victims aged 55+. This shows that non- victims aged 16-64 are more worried about being a victim of crime than non-victims aged 55+.
When looking at non-victims, the correlation coefficient of 0.016, shows that there is still a weak, positive association between age and fear of crime.
However when looking at victims, the correlation coefficient of -0.023, shows that there is a weak, negative association between age and fear of crime.
This shows Specification as the conditionals are split, the relationship between the original variables differs for various types of people, i.e those who have been victims and those who have not.
My research question could further be explored using different variables to represent the concept ‘characteristics’, such as gender. This would examine which type of personal characteristic most effect fear of crime. Alternatively using different third variables i would be possible to compare other factors linked to age and fear of crime.
Part B – (See appendix 3 for articles and appendix 2 for comment bubbles)
In preparation five online newspaper articles were chosen from the qualitative data set and other sources. These articles where then analysed for authenticity, credibility, representivness and meaning. Next, Sensitising concepts were identified and common themes which emerged were noted for exploration.
Media portrayal of age
Older people
The media predominantly portray older people as the foremost victims of crime, shown in Article22(para6) “crime is the biggest worry for elderly people.” In pin pointing the “elderly” as more worried about crime, it makes those people who already fear crime liable to continue, with the likelihood of exacerbating it, whilst suggesting to those who don’t that they possibly should. In contradiction, Articles23&24 show that the risk of being a victim of crimein reality ‘decreases with age’, thus elderly people shouldn’t be so fearful. In all of the articles older people are labelled as “Pensioners” “elderly “and “OAP’s”, this is an example of Heightened language as it simply makes older people sound frail, vulnerable and older than they actually are.
Younger people
Article24(para11) states; ‘a lack of trust between the old and young contributes to fear’. It is possible this stems from the media’s portrayal of the young as perpetrators of crime, ‘caught two teenage boys breaking in’. Furthermore, Article18(para1&2) shows evidence of the negative portrayal of the young, describing them as ‘hooligans’, which enhances fear of them. Thompson(1998) states.
“For a century and more, there have been panics over crime, and the activities of ‘youth’. . .presented as. . .a threat to the established way of life”.
This suggests that panics about youth crime have existed for some time and will continue in the future. However “Newspapers are always quick to point out if an older person is a victim”, but the same does not apply to younger victims, tending towards the view that elderly are at higher risk. This albeit is contrary to the fact that the young, mainly “young men”, are actually most at risk of crime. Furthermore the young also fear crime, shown in article 24(para18), even the young people said they were cautious about walking after dark.” Thus the young fear being victimised too, but not to the same extent as the elderly.
Media portrayal of Fear of crime
People’s safety
Article23 has the headline “ Burgled pensioners 'die early’” this forces the reader to question the safety of old people, be it themselves or others, thus producing fear. Article23 goes on to suggest ‘Pensioners who are burgled are far more likely to die earlier’ highlighting ‘health deterioration’ and being movement into ‘residential care’. This shows that impacts on old people’s safety can have serious affects on their health. Article11(para6) supports this stating ; “people have lost the confidence to stay in their own homes. . .moving into care because of fears”. This suggests old people are being push out due to safety fears. In addition, Articles11&18 show evidence of other people’s fears for elderly safety, article11(para7) “. . . . people living on their own I feel sorry for", thus it is not just the elderly that don’t feel safe, other people don’t think it’s safe for them.
Feelings of fear and victimisation
The sense of victimisation felt by the elderly is made evident in Article24(para12) showing how people believe they “inevitably become victims of crime as they got older”. However contray to this the British Crime Survey (BCS) shows, “risk of being a victim...decreases with age”, therefore the young should fear victimisation more. Article18(para4) states ..."Every resident in this street has suffered some kind of crime”, this suggests that crime victimisation is not an isolated to the elderly. Article23(para13) shows that information read by people often increase fear, “Statistics... enhance... fear”, furthermore eolder don’t always understand statistics to seek comfort in them.
Use of exaggerative/heightened language
Heightened and exaggerative language is used in many articles to grab the readers attention. Article18(para1) uses language such as “TERRIFIED” in order exacerbate people fear of crime. The use of upper case furthermore makes it more prominent, intensifying the feeling of fear. This technique is also evident in other articles, where harsh, and ‘over-the-top’ descriptive language like ‘smashed’ and ‘ransacked’ generate feelings of fear. Further phrases such as ‘prisoners in their own houses’ are extreme, suggesting that people are trapped in their homes. Throughout most of the articles such language is used to inform andto capture the reader’s attention. They however induce a great amount of fear, especially for the elderly who the media exaggeratively portray as targets.
Conclusion
Overall, many articles were clear to point out that based on statistics those at highest risk, are the young. In contrast the media’s language suggests different and while the media continues to portray victims as the weak elderly is not surprising they fear crime most. Media techniques tend to over-sensationalise crime elevating fear levels, adding to the elderly’s already high fears, and making others fear for elder’s safety. Although elderly people are not the specific targets of most crimes, their fear exceeds their risk, and unless the media change their approach to crime this will continue.
Part C – Triangulation
Quantitative analysis found that younger people fear crime more than older people, however the correlation coefficient was weak thus, this relationship insignificant. Even so this does not mean no link is possible, when bringing in victimisation at multivariate analysis, in exploring the relationship between victims, age, and fear of crime the elderly victims, were found to show a higher fear than younger victims. This suggests that a relationship between age and fear of crime is only significant when these factors taken into consideration.
Quantitative research such as that used often lack validity as it involves collecting numerical data which gives no explanation, thus doesn’t carry detail. Nethertheless, it is seen as reliable because it is generally easy to replicate in comparison to qualitative data.
Qualitative research is often rich in information consisting of detailed descriptions and capturing personal perspectives and experiences. Nonetheless, qualitative data also has it problems as due to its, subjective nature making it difficult to control researcher bias.
The analysis of qualitative data concluded that elderly people ‘are’ more worried about crime. This appears due to Media techniques that over-sensationalise crime . Although elderly people are not specifically targets of most crimes, their fear exceeds their risk as, the media induce a great amount of fear, when exaggeratively portraying the elderly as targets.
The difficulties highlighted with both types of research can be overcome by a combination, quantitative can complement qualitative methods by adding words to numbers and vice versa. This allows the findings to be viewed from two different perspective's using two data sources, thus a more correct conclusions may be drawn.
When linking the results we can see that when victimisation, ‘ a key aspect of crime fear’, is put into the equation a link can be found in the statistics to show elderly fear crime more than younger victims. It is elderly victims that the media affect when talking about crime as they do, because victims are most affected by the exaggerative methods used, which simply make fears worse.
Therefore when answering the research question, the data suggests no link is possible between age and crime, as there is no significant evidence. In fact it appears that the Media mearly ‘thinks’ there is a link, and interprets crime for public perception as such. Therefore unless the media change their approach to crime the elderly’s fear will continue, and possibly worsen. These findings appear to support Angus Reid 1994 “while 19% of non-victims express a great or fair amount of fear of being a victim of crime, 30% of victims express this fear”. However further experimentation of this would provide beneficial for more conclusive support.
References
Angus Reid. (1997, July/August). The Angus Reid report.
BBC News, 2003, Burgled pensioners ‘die early’, [online], BBC News, Last accessed 29th December 2009 at
BBC News, 1999, Elderly couple caught burglars on camera, [online], BBC News,Last accessed 29th December 2009 at
CASCIANI, Dominic, 2003, Fear of crime ‘trapping elderly’, [online] BBC News, Last accessed 4th January 2010 at
Dull, R. T., & Wint, A. V. N. (1997) Criminal victimization and its effect on fear of crime and justice attitudes. Journal of Interpersonal Violence, 12(5), 748-758.
RCJ 11, COONEY, Katie, 2004, Belfast news letter- Fighting crime against OAPS comes of age, 1st Edition; NEWS; Pg. 16
RCJ 18, 2004, Peterbrough evening telegraph- Residents living in fear of yobs.
THOMPSON, Kenneth, (1998), Moral Panics, London, Routledge. P.