Gini has many attractive features:
- The most attractive feature of the index is that it satisfies the Pigou-Dalton Transfer Principle, which requires that a transfer of income from the poor to the rich should increase inequality measure and vice verse. This is the least one should expect from any income inequality measure.
- It is sensitive to transfers, but this depends on ranking of individuals as opposed to their numeric scores. Gini is most sensitive to transfers around the middle of the distribution and least sensitive among the richest and the poorest. Gini is particularly appealing to someone concerned with changes in inequality among middle income earners. In this sense it may not very appropriate for measuring inequality in developing countries which tend to have large number of poor population together with great inequality among the rich layer.
- Gini is independent of the scale of Population and Income. This means cross country/regional comparisons are possible. Income independence means doubling income for example will not alter the measure. In general it is desirable for a measure to respond to relative rather than absolute differences.
- It preserves anonymity. It is independent of any characteristic of an individual apart from their income. This is also a disadvantage of the Gini, this I will discuss later.
- The Gini is decomposable only if the sub-groups of the population are not overlapping in the vector of incomes. This is one of the main downsides to Gini. Again I will come back to this.
Gini is defined as follows:
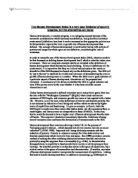
Table 1 presents values of Gini for several developing and developed countries. What is immediately apparent from the table is that higher levels of development do not necessarily imply greater income equality. For example inequality is much higher in USA – 0.401 compared to India – 0.297. This puts some doubt on Kuznets [1955] model where he suggests income inequality is something developing countries have to put up with if they are on the path to development. This again reminds the dangers of looking at values of inequality measured in income space.
Table 1
Source: World Development Report 1999/2000, World Bank
Problems with Gini Coefficient
Although Gini has many attractive features unfortunately it has problems as well.
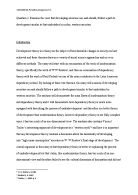
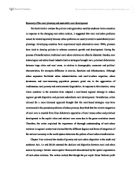
It is possible that Gini will rank the same set of distributions in different ways. Consider the two distinct set of distributions in Figure 2.
Figure 2
Lorenz Curves
Obviously the Gini coefficients for these distributions are the same; this is because the areas between the 45° line and the Lorenz curves are equal. Set 1 represents a society with more equal distribution at the top, while Set 1 is a distribution with more even dispersion at the bottom. It is open to debate which one is more desirable. An alternative method of measurement – Stochastic Dominance can be applied when the rankings are ambiguous; I am not going to discuss this here.
We could be deceived by change in Gini; social, demographic or occupational shifts might change the level of inequality. For example if there is greater inequality within one sub-group compared to another, then other things being equal if the subgroup who has lower inequality increases in scale then inequality would seem to go down. For example over the past decade, rapid structural transformation in the Hong Kong economy has led to an increasing demand for managers, administrators and professionals and hence faster increases in salaries and wages for people working in these jobs than those working in other jobs which require lower level of knowledge and skill. Income disparity thus widens as a consequence of such variations in salary increases. It should be noted that a certain degree of income disparity is rather common in the more economically advanced countries or territories. Perhaps this explains high Gini for USA we observed earlier.
It is particularly important to be able to compare Gini coefficients for different years, for policy evaluation purposes for example. However there are problems with comparing Gini coefficients. This is because the aggregate income levels are different for each year. This need not be much of a problem if the differences in annual incomes are spread proportionally across the whole population, but could be one if particular share of the population bears most of the change. For example, imagine that in a particular year the richest 5% of the population suffer a 25% reduction in their income, while the rest of the society does not experience considerable reductions. In this case the Gini coefficient will go down, suggesting a more equal distribution of income, although the poor are no better off.
Although anonymity is an attractive feature of the Gini index it poses some limitations as well. We cannot trace what happens to a particular individual or sub-group. For example we might want to find out who were mostly affected by a particular policy to asses whether it achieved its objectives. Decomposition is very important and Gini is not particularly attractive when it comes to this.
Changes in income also pose problems. For example If a rich person gets richer whilst everyone else’s income stays the same, the effect on Gini coefficient is negative, although no transfer of income from the poor to the rich has taken place. It is not straightforward whether this feature is desirable or not.
One risks jumping into conclusions about the state of inequality in a country if the Gini coefficient is measured in income space. We must not forget that income is not an end in itself. It is solely means of getting or achieving something, which is desirable. People have diverse desires, which in turn means individuals can achieve the same level of utility with different levels of income. For example, John likes playing football, while Ann enjoys horse riding. John derives the same level of utility from playing football, as does Ann from horse riding. Clearly Ann and John need different levels of income to fulfill their desires. For the sake of simplicity, let’s assume that football and horse-riding are the only form of entertainment allowed in this particular society that Ann and John happen to live in (due to health and safety risks). Given this situation, it is very much debatable whether it is just for both of them to receive equal levels of income.
However one could argue that in developing countries income is related to well-being to a higher degree compared to developed countries. This gives more support for income based inequality measures.
Measurement Problems
There are some measurement problems associated with Gini coefficient which undermine its usefulness. Most of these are not exclusive to Gini.
Time Period. Ideally one would want to measure Gini for longer periods of time. Inequality tends to be higher when one looks at a shorter period. This is due to the fact that incomes fluctuate. This volatility effect fades out the longer the period one looks at. Now this poses problems for LDCs, as proper statistical data are only available for recent years if they are available at all. Ideally we would want to look at secular incomes to eliminate the volatility effect, associated with young and old population.
Unfortunately one of the problems with measuring development indicators is the lack of accurate statistical data. In some cases the data can be manipulated with to give a positive picture of the country. These can lead to wrong policies implemented which in turn can have dramatic consequences on a country. Perhaps an extreme example is when approximately 16-30m people died of starvation in China in 1958-61 partly as a consequence of mispresented statistical data.
The problem is further worsened if a significant share of income is earned illegally, for example bribery, embezzlement, criminal activities and others. This income goes unaccounted for, as result the corresponding Gini coefficient does not reflect the true level of economic inequality in the country. Indeed illegal sources of income represent large shares of GDP in developing countries.
Different countries have different ways of collecting and presenting income data. This poses obvious comparison problems. This may even be different within the country for different periods. For cross country comparisons there are problems of differences in relative prices, artificial exchange rates and public expenditure just to name few.
The Gini does not take into account other incomes of individuals such as transfer incomes from the government, free education or healthcare and etc. Indeed these can be quite large. Needles to mention, this poses comparison problems.
Uses of the Gini index
We now come to the heart of our discussion namely - what does Gini index tell us about the state of inequality for a developing country? At the very simplest the measure tells us how even certain variable, the dispersion of which we are interested in, is distributed. In our case the variable we concentrated on was income. Higher value of Gini implies a more uneven distribution and vice verse. However there are many areas we can use the index in. For example it can be used in combination with poverty and growth measures or others for further development analysis. For example recently income inequality has been linked to violence in Russia.
It is very useful for policy evaluation purposes and feedback. Did introduction of income tax lead to less income inequality? – is one of the questions addressed by Gini. For this purpose especially, it seems the measure is more important to developing countries.
The Gini may alert us to Imperfections in the Capital Markets of a country. This means poor people do not have access to credit to finance profitable ventures to get them out of poverty simply because they are not creditworthy. Indeed recent empirical study by Barro (1999) finds that this effect is significant for developing countries but slowly disappears for more developed countries. This is mainly due to the fact that financial markets are least developed in poorer countries.
Higher Gini, however does not necessarily imply worsening of poverty situation. For example if rich get richer proportionally more than poor get richer then this would be recorded by Gini as an increase in inequality.
The Gini is not very useful when it comes to decomposition of the inequality measures. Decomposition is important if we want to study sub-groups (different age, sex, racial groups) of the population.
e.g. Gini coefficients for different geographical sub-groups. Example – Zambia:
Rural – 0.456
Urban – 0.401
For this purpose other measures such as variance coefficient and especially Theil’s entropy coefficient are more appropriate. Gini does not lend itself easily to breakdown by factor components (e.g. labour income or property income) either although some have shown ways getting round these problems (Jacques Silber [1989] for example).
Gini can be used to assess policies implemented by the government to see whether they are appropriate or not. For example in their recent study of Gini coefficients for China Zhao and Tong (2000) show how “get rich first” policy and “coastal development strategy” influenced by Williamson’s inverted-U hypothesis and the centre-down paradigm, have led to serious problems affecting China. It can sometimes prompt as to take appropriate action to correct the policy wrongdoings or implement the right policies in the first place.
One always needs to go back and check where the variations in Gini come from. For example the government of a developing country may implement a policy aimed at reducing economic inequality. At the end of the period statisticians present the government with a reduced Gini. One could come to the conclusion that the policy was successful. In reality it is quite possible that the policy only slightly achieved its objective and the change was caused by another force, for example huge increase in western aid.
Conclusions and Final Thoughts
We have looked at some advantages and disadvantages of using Gini coefficient as an indicator of the state of inequality in developing countries. Generally speaking Gini coefficient is a good measure of inequality in that it has some desirable properties we would expect a good inequality measure to posses. Of course there are problems, some quite serious, associated with the index. Although some of these can be avoided by using other measures or possibility of a better alternative altogether this is probably as far as arithmetics can go. A different model has to be designed if it is to take into account problems such as social or occupational shifts.
Any measure is only as good as the data it is based on. Measurement problems undermine Gini as an inequality measurement. From this aspect things are not looking bad for the Gini, as quality and availability of data is on the increase.
Gini coefficient measured in income space gives an incomplete picture of the level of inequality in a country. Ideally we would want to know the level of happiness inequality in a society, which is what really matters. Given the infeasibility of such a measure we instead have to rely on measures of inequality in spaces, which are more or less correlated with happiness and are measurable; thus the long term tradition of concentrating on income inequality. Perhaps a better picture could be presented by looking at several Gini coefficients of a country, measured in spaces which are regarded as important, such as income, health, education etc or even looking at a coefficient that is an average of these Gini coefficients.
REFERENCES
Anthony B. Atkinson, “On the Measurement of Inequality”, Journal of Economic Theory, Vol. 2, 1970
Amartya Sen, “On Economic Inequality”, Expanded Edition, Oxford University Press, 1999
Francois Bourguignon, Decomposable Income Inequality Measures, Econometrica, Vol. 47, No.4, July 1979
Frank A. Cowell, “Measuring Inequality”, Second Edition, Prentice Hall, 1995
Paul D. Allison, “Measures of Inequality”, American Sociological Review, Vol. 43, December 1978
Persson T. and Tabellini G., “Is Inequality Harmful for Growth?”, The American Economic Review, Vol. 84, Issue 3, June 1994
Subramanian S., “An Elementary Interpretation of the Gini Inequality Index”, Theory and Decision, Vol. 52, No 4, 2002
World Bank, “World Development Report 1999/2000”, The World Bank, 2000
X. B. Zhao, S. P Tong. , “Unequal Economic Development in China: Spatial Disparities and Regional Policy Reconsideration, 1985-1995”, Regional Studies, Vol. 34.6, 2000
Word Count: 2940