The analysis started with the drawing of an influence diagram. I also needed to draw a mind map outside the group after the first session to help me make sure I was comfortable with all the issues and where they fitted in. Mind maps I feel are easier to use and after working on the influence diagram I needed to restore my confidence in being able to understand the problem we were dealing with.
Influence Diagram
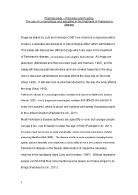
The Influence Diagram we created for this problem is shown in Figure 2.
From this we can see that the perceived risk of the triple MMR vaccine (triple) is very much at the centre. By looking at some of the feedback loops from this central point it helps us understand the dynamics of the problem. I have identified a couple of feedback loops by highlighting them with coloured arrows.
The first one I am going to discuss has pink arrows. This feedback loop is referred to as a growth loop. It shows the perceived risks of the triple being greater than the risk of the disease impacting our sales negatively. As our sales decline then the number of vulnerable children increases. This eventually gives rise to more cases of disease although there is a delay in this happening as symbolised by the ‘D’ on the arrow. Even with the use of the triple being as low as 80.9% in some areas as the decline is only a relatively recent phenomena we are not seeing the full impact yet. With more children getting the disease there are more opportunities for the disease to be cured therefore growing the perception of the risk of the triple being worse than the disease itself. The view that the disease can be treated powering this. The fact that there are more occurrences of the disease could also mean that there are more deaths, which would then have a positive impact on the view that the disease is worse than the triple. This type of loop is referred to as a drain loop.
The feedback loop identified by green arrows is another example of a growth loop. That is by going round the loop the perceived risk of the triple is being amplified. Here the possible take up of the triple by public figures is reducing. However they are remaining silent and yet the Government is meant to be supporting the use of the triple. This silence is increasing the mistrust of the establishment that then goes onto increase the public perception of the triple as being a greater risk as the government recommendations are not being trusted even by themselves.
Figure 2 Influence Diagram
Another major part of the influence diagram are the pressure points. These are the issues that impact onto the problem but do not take part in any loops. For example in the bottom left of the diagram we have identified the media’s desire to sell news as an external force. On the bottom right we have the Governments new policy of funding pre school places impacting the level of mixing being done by children. The point being the more the children mix the greater risk of disease spreading if they have not been vaccinated.
TOWS Analysis
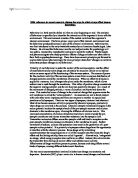
The next stage is to perform a TOWS analysis. This involved looking externally and internally at the problem. Externally by examining the threats and opportunities and internally by looking at the strengths and weaknesses. This analysis is shown in Figure 3.
We identified 37 items to put into this analysis which is verging towards a limit of how many we could deal with. Over half of them were new to the analysis that is they were not explicit on the influence diagram. For example one of the strengths of the triple we saw as being reduced pressure on GP surgeries. By this we mean there are less appointments to make and reduced recording to be done if there is one jab compared to three single ones. Many parents would organise separate appointments for each jab not wanting their child to suffer three in one day. Other examples include government public health targets as an opportunity and NHS reform of more choice as a threat.
Figure 3 TOWS analysis
TOWS Potential Action Plan
Having looked at the TOWS analysis we started to deduce the actions that could come out. The total set of actions we derived is shown in Figure 4. As we were going about this process we had to make various assumptions which we recorded and can be seen in Figure 5.
Figure 4 Action Set from TOWS analysis
The actions come about by joining together different elements of the TOWS. For example by comparing the Governments role in the health of the nation in looking at O4, O7 and O8 we can link this with the fact we have no relationship with parents W6 in order to force the use of the triple. By doing this the Government are not having to pay for the more expensive singles version and therefore save cost, O2, S2 and S4. We have a long-standing relationship with the Government (S7) so we may be able to push this policy forward. However, I would also want to add in that T12 maybe against use in terms of what the Government is prepared to do with these types of reform. Also in our favour is the Governments current refusal to fund singles (S5), which is backed up by the research that says there is no risk with the triple (S3).
Figure 5 Assumptions Made To Create Action Plan
Once we had worked through creating the actions from the TOWS analysis we checked back to our influence diagram to make sure we had captured all our thinking. This can be seen by connecting the last column in Figure 4 with the influence diagram in Figure 2. We also checked we had covered every TOWS element by looking at each of the actions and ticking off the relevant TOWS elements.
From our TOWS we came up with a total of 10 actions. These actions can be grouped into the groups as shown in Figure 6.
Figure 6 Action Plan Groups
Viable Strategy Matrix
The factors, that is the column headings, for the Viable Strategy Matrix were developed from the TOWS action plan groupings seen in Figure 6. The Viable Strategy Matrix can be seen in Figure 7. The matrix is split into two column types, factors outside our control but are measurable referred to as the outcome. As well as factors we can control which are referred to as inputs.
At present the XYZ pharmaceutical company situation is highlighted in orange on the Viable Strategy Matrix. This tells us that the Government currently supports the triple vaccine, the company is involved in research but it is slow and developmental, the press mistrust them and are much more likely to cover negative stories as this sells papers and they have some knowledge about the patterns of uptake of the triple but clear enough to develop a strategy for targeting. For example they are aware there are some regional aspects to this.
A set of possible viable strategies for the pharmaceutical company to follow has been highlighted in green. It suggests that the company should strengthen its relationship with Government, the status for research should stay the same, press relations should be improved and a greater understanding of where the non uptake is occurring be developed.
The development of the strategies as suggested above should then move the company from seeing a few outbreaks of measles to the triple reaching WHO recommended levels.
Figure 7 Viable Strategy Matrix
Congruence Analysis
To check whether the developed strategy could work we carried out a Congruence Analysis. First we made some decisions about who the interested parties were. These are the column headings in Figure 8. They include the parties already identified, Government and Press, but also include other parties. Parents are one of the interested parties and we felt we needed to split this group into sceptics and supportive. This was to show the different attitudes of the two groups. For example Sceptic Parents would become even more sceptical if they thought we had some power over the press. Any attempts to improve this area therefore gets a negative score as far as this group is concerned. Whereas the supportive parents would not have such strong views as they think the company is doing a good job. It does not allow for a group of parents that sit in the middle. The parents who have the jabs but are still sceptical about drug companies but cannot bear the thought of not having their child immunised and understand that research actually weights in favour of the triple.
If competitors were taking out of the analysis on the whole there is very little negative reaction. So it would appear that the strategy has potential. The greatest area of negativity is the Press so we to focus on them. If we do this then the Sceptic Parents will get different information in hope they change their views. Plus with our other strategies for our Government relations we should have impact on this group of parents. With our analysis on the patterns of uptake we can then concentrate our efforts in the right place. For example if it is a regional issue we can concentrate on the local press. If it turns out to be more of a socio economic groupings then we could devise media plans around the papers the non uptake group reads.
Resource Analysis
In order to implement the strategy we need to look at the companies’ current resources. We can then decide if there are any gaps they need to fill. The resource analysis is shown in Figure 9. The higher the figure in the last column the greater level of resource for that area needs to be
Figure 8 Congruence Analysis
Figure 9 Resource Analysis
implemented. In the case of XYZ pharmaceuticals the largest effort needs to go into Press Relations. From the Congruence analysis we know that where we focus depends on the definitions of the non uptake group. Although doing this anyway will have an effect, doing it along with the non uptake understanding will make it more powerful and effort better spent.
Force Field Analysis
Our first look at Force Field Analysis we took the levels to be related to revenue. The current level was falling, acceptable level was static revenue and the desirable was increased revenue. It was the last piece of analysis we did at the end of a long session. The next session we decided to review what we had done and it was totally changed. This time we developed two Force Field Analysis. The first looking at what was reacting to getting the Percentage of the population jabbed. The targets here are the desirable protection levels of 95% set by WHO. Whether the protection levels are achieved by using the triple or single is not the issue. This can be seen in Figure 10. The biggest impact on increasing overall protection levels would be for a measles outbreak to happen. As we have no control over that the next biggest action is that of the Government in terms of education and their relationship with GPs. It maybe the way Doctors are rewarded for the jabs could be changed to promote the vaccination program. Even with the outbreak of measles if the population think the cure is strong then still some people will choose not to vaccinate. On balance this Force Field Analysis does not give the company too much to worry about. However, looking at the second version of the Force Field Analysis tells a very different story.
Figure 10 Force Field Analysis - Protection Levels
The second version of the Force Field Analysis took Market Share as the focus. We took 100% Market Share to mean all of the children vaccinated were having the triple. Realistically we know that may not be achievable, as the single jabs are an option so we would need to set a feasible level. As we are not sure what the current split is between the two jabs we have not set this. The diagram for this is shown in Figure 11.
The overall picture looks fairly balanced. Even though the mistrust of the Government is seen as a powerful restraint, indicated by the thickness of the arrow, the actions indicated by the upward arrows do not let this totally overpower the situation. It highlights the usefulness of understanding the use and non use patterns in terms of demographics. This has impact on the Press Pack allocation as well as the survey. Two actions which are combating big restraints to the actions.
Figure 11 Force Field Analysis - Market Share
Recomendations
To answer the original question the analysis has come up strongly in favour of the following actions as part of the solution:
- Understand the patterns of use and non use
- Improve Government Relations
The biggest barrier to the last two is one of resource, particularly PR. A deeper review of the company’s capabilities in this area is suggested with the view to either further recruitment of specialised skills or outsourcing.
Part C
Limitations and Benefits of the technique
The technique gives structure when looking at complex problems. The end result is a solution not just deeper understanding of the problem. Given that you have a complex problem instead of getting totally bogged down with it you feel slightly more relaxed as you have a process you are about to follow to get to a solution. The structure is flexible in which bits get used as not all have to be done and not all parts suit a particular problem. Also you may have some personal preference to particular parts. For example the first stage you need to make sense of the problem and there are a variety of ways this can be done. For example using rich pictures. mind maps or influence diagrams. Although an influence diagram gives added perspective on a problem over a mind map I do not think they are as easily learnt. However people can be put off from using rich pictures if they feel they do not have the necessary drawing skills. Although I have said that some elements of the technique are more difficult to grasp than others on the whole the technique is very easy to teach but needs practice.
The people who will be responsible for the implementation of the problem should drive the whole process. However, their knowledge of the techniques maybe limited and this can cause more focus on the learning of the technique than on the problem itself. The more experience you have of the technique the more powerful it becomes. A facilitator could aid the lack of knowledge. They should be independent and make sure everyone’s view is taken into account. If facilitated well you should end up with the whole teams perspective. The technique is more successful when done as part of a team but an individual can use it. The whole process works better if there is some balance in the team where there are no dominant characters. Again a facilitator plays a role here.
The whole technique is very problem independent, it can be used for any problem. You need to start with a question and getting this question right at the beginning can be an issue and may need several iterations of starting the process over again before you get the right one which can be frustrating.
You must be careful in not letting heat of the moment solutions or ideas take over. This can be solved by allowing the whole process to take several days and allowing some reflection time as a fundamental part of the process. This definitely aided our analysis to the MMR problem as we ended one of the days with a force field analysis, which we rushed to get through as we were running out of time. However, we started the next session with a review of what the force field had achieved and with fresh eyes we came up with a far better analysis. This resulted in two force field analyses. An example of the techniques flexibility. It allowed the process to be adjusted to suit the particular problem.
The technique could benefit with a ‘WU’ at the beginning for ‘Warm Up’. Going into the technique cold can make the process hard work. A facilitator can aid this but if a team is going through the process for themselves to make it an explicit element to it would aid the rest of the process.
As you do not need to reject elements of a problem the technique encourages debate rather than arguments. However it does require a certain amount of flexibility and imagination and dependent on what sort of group you are working with will limit what solutions are output from the process.