THE HIGHER THE KS2 RESULTS OF STUDENTS, THE HIGHER THE IQ RESULTS ARE. I have chosen this particular hypothesis because many students who tend to have a high IQ, have a high KS2 result too
Mayfield High School Maths Coursework
My Hypothesis
My first hypothesis which I have chosen to test is:-
THE HIGHER THE KS2 RESULTS OF STUDENTS, THE HIGHER THE IQ RESULTS ARE.
I have chosen this particular hypothesis because many students who tend to have a high IQ, have a high KS2 result too. I have also chosen this hypothesis because, many students at my school who have a high IQ tend to do well in their KS2 exams and get a high grade and therefore I would like to find this out for my-self.
The data which I will be using to find out if my hypothesis is right or wrong will be from Mayfield High School. All the data that I will need will be provided for me at school on the computers. This data will include a range of different information on students from years 7-11.
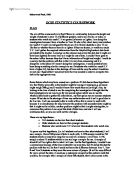
Sampling
For my hypothesis I will be choosing a sampling size. I have chosen my sample size to be 50, as it will be more accurate. Also using the sample size of 50 will give me a wider range of data and therefore help me with my hypothesis more. There are various samples, which can be used. However, I am going to use random sampling and stratify sampling and this way it will avoid bias results. The random sampling will pick out my data in any order. The below formula is used to stratify my samples.
The formula that I will use to work out my samples is:-
Number of students used in sample=
Total number of girls/boys in year X Sample Size
Total number of students in the school
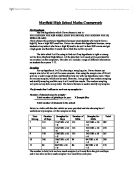
Below is a table with the data which we were provided and also showing how I worked out my samples. All the samples are 0d.p
Year Group
Number of Boys
Samples for Boys
Number of Girls
Samples for Girls
Total
7
51
51/1183 x 50
= 6
31
31/1183 x 50 = 6
282
8
45
45/1183 x 50 =6
25
25/1183 x 50 = 5
270
9
18
18/1183 x 50 = 5
43
43/1183 x 50 = 6
261
0
06
06/1183 x 50 = 4
94
94/1183 x 50
= 4
200
1
84
84/1183 x 50 = 4
86
86/1183 x 50
= 4
70
The number in bold, tells me how much samples I will need from the girls and boys and it also tells me how much samples I will need from each year.
Random Sampling
After doing the stratified sample, I had to choose the students which I will use to prove my hypothesis. I will need to pick them out from the data which is provided on a spreadsheet. I will pick the samples out by using the random formula which is:-
(RAND()*150+1)
However, the number after the * changes depending on how much girl or boy students there are in that year. When I put the number in I had to minus one away and then add one back on. However, as I wanted a couple ...
This is a preview of the whole essay
Random Sampling
After doing the stratified sample, I had to choose the students which I will use to prove my hypothesis. I will need to pick them out from the data which is provided on a spreadsheet. I will pick the samples out by using the random formula which is:-
(RAND()*150+1)
However, the number after the * changes depending on how much girl or boy students there are in that year. When I put the number in I had to minus one away and then add one back on. However, as I wanted a couple of samples for the same year and same gender, I kept on pressing F9 until I got the random amounts of students I needed. Below are all my samples which I have gathered by using the random formula:-
Random Numbers
For Year 7 Boys: - 103, 119, 89, 6, 4, 78
For Year 7 girls: - 73, 114, 30, 23, 34, 76
For Year 8 Boys: - 134, 96, 29, 60, 63, 104
For Year 8 Girls:- 39, 69,112, 36, 10
For Year 9 Boys: - 64, 11, 14, 48, 81
For Year 9 Girls: - 6, 130, 54, 101, 28, 4
For Year 10 Boys: - 66, 88, 57, 84
For Year 10 Girls: - 60, 53, 66, 47
For Year 11 Boys: - 37, 26, 8, 16
For Year 11 Girls: - 65, 50, 43, 33
Relevant Data
The table below shows the IQ and KS2 results of each student that was selected. This is all the necessary data that is needed. However I have not noted which students are from which years to make sure it is not biased in any way.
IQ
ENG
MATHS
SCIENCE
107
5
5
5
06
5
4
5
108
4
5
5
01
4
4
4
99
4
4
4
04
4
5
5
22
5
5
5
00
4
4
4
04
5
4
5
00
4
4
4
09
5
5
5
97
4
4
4
00
4
4
4
12
5
5
5
00
4
4
4
14
5
5
5
00
4
4
4
05
5
4
4
89
3
3
3
14
5
5
5
08
5
5
5
01
4
4
4
01
5
4
4
92
3
3
4
02
5
4
4
91
3
3
4
09
4
5
5
02
4
4
5
91
3
4
4
17
5
5
5
10
5
4
5
00
4
4
4
16
5
5
5
01
4
4
4
00
4
4
4
00
4
4
4
10
5
5
5
02
3
5
4
99
4
4
4
00
4
4
4
92
3
3
3
92
4
3
3
96
3
3
3
06
5
5
5
03
5
4
4
00
4
4
4
03
4
4
5
00
4
4
4
98
4
4
5
92
3
3
4
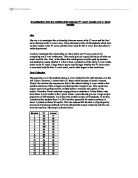
My Graph
From my samples I am going to create a graph. I have decided to do a scatter graph because; it will make it easier for me to see if my hypothesis is correct. It will make it easier for me see this, as all my points will be plotted on the graph and therefore it will give me a better understanding of my results and also a clear view of my correlation line. Below is my graph:-
From the graph you can see that my hypothesis is correct. This is because as the IQ results are going higher, so are the KS2 results going higher. I think this because, the clever you are, the more intelligent you are, as you know many things and you can gain more marks. However, from the graph you can see that there is a strong positive correlation. We can see this because, as the KS2 results are going higher, the IQ goes higher too. For example, a student who has a low KS2 result, such as, a level 3, they have a low IQ. However, if you look at the graph, a student who has got a level 5 for English, Maths and Science has got the highest IQ.
Product Moment Correlation
YR GROUP
X
Y
XY
X
Y
Yr 7 Boys
07
5
535
1449
25
06
5
530
1236
25
08
5
540
1664
25
01
4
404
0201
6
99
4
396
9801
6
04
5
520
0816
25
Yr 7 Girls
22
5
610
4884
25
00
4
400
0000
6
04
5
520
0816
25
00
4
400
0000
6
09
5
545
1881
25
97
4
388
9409
6
Yr 8 Boys
00
4
400
0000
6
12
5
560
2544
25
00
4
400
0000
6
14
5
570
2996
25
00
4
400
0000
6
05
4
420
1025
6
Yr 8 Girls
89
3
267
7921
9
14
5
570
2996
25
08
5
540
1664
25
01
4
404
0201
6
01
4
404
0201
6
Yr 9 Boys
92
3
276
8464
9
02
4
408
0404
6
91
3
273
8281
9
09
5
545
1881
25
02
4
408
0404
6
Yr 9 Girls
91
4
364
8281
6
17
5
585
3689
25
10
5
550
2100
25
00
4
400
0000
6
16
5
580
3456
25
01
4
404
0201
6
Yr 10 Boys
00
4
400
0000
6
00
4
400
0000
6
10
5
550
2100
25
02
4
408
0404
6
Yr 10 Girls
99
4
396
9801
6
00
4
400
0000
6
92
3
276
8464
9
92
3
276
8464
9
Yr 11 Boys
96
3
288
9216
9
06
5
530
1236
25
03
4
412
0609
6
00
4
400
0000
6
Yr 11 Girls
03
4
412
0609
6
00
4
400
0000
6
98
4
392
9604
6
92
3
276
8464
9
Total
?5125
?98
?21732
?527837
?904
Standard Deviation for X and Y Data
Standard deviation for IQ Results
SD = ? ? ² ? ? ²
------- - -------
n n
n = 50 (number of samples)
? ? = 5125 (whole sample added together)
? ? ² = 527837 (Square of each data point of the sample added together)
SD = 527837 5125 ²
--------- - ---------
50 50
SD = 10556.74- (102.5)²
SD = 10556.74- 10506.25
SD = 50.49
SD = 7.105631569
SD = 7.1 (1 D.P)
The average value for the X data is:-
5125
--------- = 102.5
50
This therefore, shows that my data is not reliable, as my points would not be close together. I know this because the number that I got when working out my standard deviation, it was, 7.11 and when I worked out the average mean I got 102.5 and therefore, these two numbers are far apart.
Standard deviation for the KS2 Results:-
SD = ? y ² ? y ²
------- - -------
n n
n = 50 (Number of sample)
? y = 98 2 (Whole sample added together)
? y² = 904 (Square of each data point of the sample added together)
SD = 904 98 ²
--------- - ---------
50 50
SD = 18.08 - (1.96) ²
SD = 18.08 - 3.8416
SD = 14.2384
SD = 3.773380447
SD = 3.8 (1 D.P)
The average value for Y data is:-
98
--------- = 1.96
50
This show that my results for my Y data is reliable, as my standard deviation answer was, 3.77 and my average value answer was, 1.96. As the two numbers are close, this therefore proves that my data is reliable.
Product Moment Correlation Coefficient
I am now going to work out the "Product Moment Correlation Coefficient" this is normally written as, Yxy. I will work this out by using the table on the sixth page. I will work this out by using the following formula:-
?xy ?x ?y
------ - ---- ----
n n n
---------------------------------------------------------
?x² ?x ² ?y² ?y ²
------ - ---- X ----- - -----
n n n n
?
SD = ? ? ² ? ? ²
------- - -------
n n
SD = ? y ² ? y ²
------- - -------
n n
Top of Yxy: - 21732 5125 98
------- - ------- x ------ = 434.64 - (102.5 x 1.96) = 233.74
50 50 50
Bottom of Yxy: -
527838 5125 ²
------------ - --------- = 7.105631569
50 50
10556.74 - 10506.25 = 50.49
904 98 ²
------- - ----- = 3.773380447
50 50
18.08 - 3.8416 = 14.2384
Yxy = 2.33.74 / (7.105631569 x 3.773380447)
Yxy = 2.3374 / 26.81225123
Yxy = 0.086900573
Yxy = 0.1 (1 D.P)
Conclusion
Conclusion for my product moment correlation coefficient
From working out the standard deviation, I have concluded that my regression line has no correlation. This is because my end result which I got after working out the standard deviation my regression line was 0.0869... This therefore, shows that my regression line has no correlation. However, I am able to tell that my regression line is a positive because it is not a negative number. This shows that my hypothesis was correct, but it was not strongly proved, as my regression line was not a perfect correlation.
Overall, from the whole hypothesis I found that the higher the IQ results a student has and more likely they are going to have a higher KS2 result too. You are able to see this on my graph earlier in the work. This therefore proves my hypothesis to be correct.