Factors affecting the speed of a trolley
Factors affecting the speed of a trolley
Travelling down a ramp
Factors such as; type of surface of ramp, height of ramp, weight/mass of trolley and the gradient or angle of a ramp all affect the speed of a trolley as it travels down a ramp. For instance a trolley may accelerate faster down a ramp on smooth wood rather than on carpet because carpet might provide greater friction for the tyres rather than the smooth wood. Out of all these factors, I am going to pick just 1 factor and alter it 5 different times, doing 3 trials for each time. We have also done some preliminary work on ticker - timers, so in my investigation I am going to expand on the notion of ticker - timers and incorporate my knowledge of ticker - timers in to this investigation.
Aim: To investigate the relationship between the speed of the trolley as it travels down the ramp and the gradient of the ramp.
Hypothesis: I believe that the speed of the trolley travelling down the ramp will increase as the gradient of the ramp is increased. This is because of several different factors.
One of these factors is Potential energy. Potential energy is stored energy possessed by a system as a result of the relative positions of the components of that particular system. In this case, it is a trolley that is held at the top of the ramp, which is above the ground; the trolley and the earth possess a certain amount of potential energy. In this experiment we are focusing on a particular type of potential energy, gravitational energy. (From here on, the phase potential energy will be referred to as gravitational potential energy.) Potential energy is the energy stored in an object as a result of its vertical position (i.e., height.) The energy is stored as the result of the gravitational attraction of the earth for the object. There is a direct relationship between the potential energy, the mass of the object and also the height of the object. In this case we are using the same trolley so therefore the mass is the same, but we are changing the gradient of the ramp and by changing the gradient we are also changing the height. The higher the trolley is elevated the greater the potential energy is.
Formula for Potential Energy
EP = m* g *h (mass x gravitational field x height) Note: * stands for multiplication
Potential Energy
By using this formula we can see that as the height of the ramp increases so does the potential energy. This is because the mass, gravitational field and the height are all related and their combined product is the potential energy. So if the height is a smaller number than the potential energy will decrease and if the height was a bigger number the potential energy will increase. Since the potential energy of an object is directly
proportional to its height above the zero position, a doubling of the height will result in a
doubling of potential energy. A tripling of the height will lead to a tripling of potential energy.
Potential energy is energy which is stored in the system, and this energy is only thought of when the system is stationery but when the system is in motion, kinetic energy comes into play. Kinetic energy is the energy of motion. An object, which has motion - whether it be vertical or horizontal motion - has kinetic energy. There are many forms of kinetic energy - vibrational (the energy due to vibrational motion), rotational (the energy due to rotational motion), and translational kinetic energy (the energy due to motion from one location to another). In this experiment I am going to focus on translational kinetic energy (from here on, the phase kinetic energy will be referred to as translational kinetic energy.) The kinetic energy of an object depends upon two variables: the mass (m) of the object and the speed (v) of the object. As the gradient of the ramp is increased so is the kinetic energy.
Formula for Kinetic energy
2
KE = 1 * m * v (Note: * stands for multiplying)
2
Kinetic Energy
This equation reveals that the kinetic energy of an object is directly proportional to the square of its speed. That means for a twofold increase in speed, the kinetic energy will increase by a factor of 4; for a threefold increase in speed, the kinetic energy will increase by a factor of 9. The kinetic energy is dependent upon the square of the speed. Kinetic energy is a scalar ...
This is a preview of the whole essay
Formula for Kinetic energy
2
KE = 1 * m * v (Note: * stands for multiplying)
2
Kinetic Energy
This equation reveals that the kinetic energy of an object is directly proportional to the square of its speed. That means for a twofold increase in speed, the kinetic energy will increase by a factor of 4; for a threefold increase in speed, the kinetic energy will increase by a factor of 9. The kinetic energy is dependent upon the square of the speed. Kinetic energy is a scalar quantity; it does not have a direction. Unlike velocity, acceleration, and momentum, the kinetic energy of an object is completely described by magnitude alone.
Also friction is another factor that affects the speed of a trolley travelling down the ramp. Friction is the result of collisions of the object's leading surface with air molecules. The actual amount of friction encountered by the object is dependent on a variety of factors. The two most common factors, which have a direct effect upon the amount of, friction, these are the speed of the object and the cross- sectional area of the object. Seeing as we are using the same trolley we can focus on the speed. Increases in speed, results in an increased amount of friction. If the speed of the trolley travelling down the ramp is high we then know that that the friction is also high.
Acceleration is a vector quantity, which is defined as "the rate at which an object changes its velocity." An object is accelerating if its velocity is changing. When the trolley is on top of a ramp with there is the biggest gradient, the trolley will accelerate more, compared to a ramp where the gradient is smaller. The bigger the gradient the bigger the acceleration.
Formulae for acceleration
Acceleration = change in velocity
Time taken
A ticker - timer is a way of analysing the motion of objects. As the trolley moves, it drags the tape through the ticker timer, thus leaving a trail of dots, which were printed there by a vibrating metal bar running on an electric current, which hits a piece of carbon paper 50 times every second. The analysis of a ticker tape diagram will also reveal if the object is moving with a constant velocity or accelerating.
The only type of change in velocity I have not shown is deceleration. Deceleration is when the trolley reduces its velocity. This can be represented on a ticker timer tape by the dots first having big spaces in between them and gradually the space between each dot gets smaller and smaller.
The bigger the gradient the more spaced out the dots will be because the trolley is travelling at a faster rate. The smaller the gradient the less spaced out the dots will be, indicating that the speed of the trolley is travelling at a slower rate.
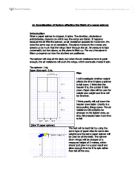
Newton law's of motion
Every action has an equal but opposite reaction
From this law we can explain the above diagram. In the above diagram Newton's law is present. Force 1 shows the ramp pushing the trolley forwards and force 2 shows the trolley pushing back on the ramp. The forces in the above diagram are equal and therefore the black arrow, which shows the trolley heading downwards, indicates the resultant force.
We can also relate the direction of the trolley to Newton's second law of motion.
The relationship between an object's mass m, its acceleration a, and the applied force f is f = ma. Acceleration and force are vectors; in this law the direction of the force vector is the same as the direction of the acceleration vector.
The trolley is pulled towards earth by the force of gravity. The direction of gravity is downwards, the direction that the trolley is going is also downwards.
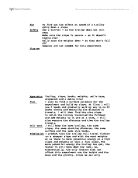
Apparatus: 1 Trolley - weight of trolley (0.8 kg) Access to a staircase
Ramp - length of ramp (1670mm) Cello tape
Digital stopwatch
Metre stick
Ticker - timer
Roll of ticker timer tape
Several clips
Pen and paper
Access to a mains socket
Method: First of all we collected all our equipment. Then we placed our ramp against the first step of the staircase. Next we prepared the ticker - timer. We did this by first cutting a suitable length of ticker - timer tape, next we plugged the wires into the ticker timer in their rightful places and threaded the ticker - timer tape through the ticker- timer. Next we placed the trolley at the top of the ramp. We then stuck the ticker - timer tape to the back of the trolley with cellotape.
Next, one of us switched on the mains, which activated the ticker - timer and one of us let go of the trolley. We then timed (with a digital stopwatch) how long it took for the ticker timer to reach the ground. We then switched off the ticker - timer. Next we wrote the result onto a piece of paper using a pen. To find the height of the stair, we measured the stair with a metre stick. We took the ticker - timer tape of, from the back of the trolley and labelled it according to the height. After our first trial for that particular height we then done another two more trails. Next we set up the ticker- timer again, making sure the wires were plugged into the ticker timer in their right places, we threaded the ticker - timer tape through the ticker timer and stuck it down with cellotape onto the back of the trolley. We then measured the time the trolley took the to travel down the ramp and jotted the time down. We repeated this process for another time so we had three trials for that particular height. We then moved on to another height. First we placed a ramp on another stair and measured its height then we measured the time taken for the trolley to go down the stairs and put that into our table. Next we did three trials for this height. In total we did five heights, remember to change the height of the ramp, and measure it with a metre stick, each time recording the height into your results table.
As you can see, in this investigation I have incorporated ticker- timers. A ticker timer is designed to print dots onto tape at a steady rate of 50 dots per second. The use of a ticker-
timer can record the motion of a trolley down a runway. As the trolley accelerates down the runway, it pulls the tape through the timer at a faster and faster rate. Therefore the dots become widely spaced because the tape travels faster and faster. The time interval between successive dots is 0.02s (= 1/50s.) The tape can be marked into 10 dot sections, each section taking 0.2s (= 10/50s) to pass through the ticker- timer. The sections get longer as the tape goes through faster and faster. Note: In our experiment we could not calculate the acceleration of the trolley because if we took the initial speed of the trolley when it was at the top of the ramp which was 0m/s, this would mean the speed was constant and would not be accelerating. The only way you can actually calculate the acceleration of the trolley is by using a ticker timer. After setting up the ticker timer, we then released the trolley, which then travelled down the ramp. After recording our results we analysed the ticker timer tape. The following steps show you how to calculate the acceleration of the trolley using the ticker- timer tape.
.) First cut the strip into 10- dot sections. Remembering that each section would take 0.2 s (= 10/50 s.)
2.) Them measure your first 10 - dot section with a ruler and write down measurement. Call this V1.
3.) Next, measure your second 10 - dot section with a ruler and write down the
measurement. Call this V2.
4.) Next subtract V2 from V1 and write the result down. Then divide this result by 0.2 s;
time taken for each second.
5.)
Now you have your acceleration of the trolley. Note: If you measuring the length of the ticker - timer tape in cm always covert into metres.
Continue this method for the rest of the heights.
Fair Testing: Fair testing is a crucial factor, which is a vital part of an investigation.
Without fair testing the experiment would be useless because the information gathered from the experiment would not be accurate/reliable. Here are some factors that I have drawn up to make my investigation as fair and as accurate as possible.
. When the trolley was at the top of the ramp, we did not apply force on the trolley e.g. pushing the trolley down the ramp instead we just let go of the trolley remembering not to apply any force on to it.
2. When putting the trolley at the top of the ramp we made sure that the back wheels of the trolley were touching the top of the ramp.
3. Make sure that you get a trolley which has all three wheels working because if one or more wheels do not work this could also affect the speed of the trolley.
4. As the trolley reached the ground, we only stopped timing when the back wheels of
the trolley hit the ground not when the nose first reached the ground.
Safety Precautions: Safety is crucial part of any investigation. All experiment possess some kind of danger, with the safety features I have drawn up the risk of danger will be minimised.
. Make sure you do not stand/sit in front of the ramp because when the trolley is
travelling down the ramp with speed and you are in front of it before it reaches a halt
the trolley will give you unpleasant plain.
2. Do not put the ramp in the air, if the trolley goes off the ramp, it is in mid- air and will reach the ground with a considerable force. Doing this might lead to damages to the trolley, yourself or any other passer by.
3. Conduct the experiment in a sensible manner.
Results/Conclusion: My results show that as you increase the height of the ramp you also increase the speed therefore decreasing the time taken for the trolley to travel down the ramp. Looking at my graphs I can see that they all support my hypothesis and all backup my predictions. My prediction of kinetic energy; the kinetic energy of an object is directly proportional to its speed was correct.
6cm the speed was 0.84 m/s 32cm the speed was 1.42m/s
6cm the kinetic was 0.28 J 16cm the kinetic energy was 0.81 J
You can see that if you divide the kinetic energy at 32cm by the kinetic energy at 16cm the answer is 2.89 (2.D.P)
If you then divide the speed at 16cm by the speed at 32cm and then square the answer the answer is 2.86.
Although the answers were not exact because 0.8 J was rounded to 0.81 J they are very similar.
Also my prediction for potential energy; as the height is doubled the potential energy is also doubled was also correct.
Height of ramp 16cm 16cm the potential energy was 1.28 J
Height of ramp 32cm 32cm the potential energy was 2.56 J
If you divide 16cm by 32 cm the answer is 2.
If you divide the potential energy at 16cm by the potential energy at 32 cm the answer is also 2.
This trends/patterns follow right through the sequence not just for the examples I have given you.
My results gives a clear indication that at an increase in gradient, means that the trolley will be accelerating more and reaching the ground more quickly. The speed of the trolley is very interesting, as I predicted the higher the height the faster the speed but towards the end of my graph the speed starts to reach a terminal speed, a constant value. Looking at my bar graph, this is a clear indication on how quickly the speed decreases when the height increases. The potential energy graph, was the graph with most stability as the line of best fit nearly matched the normal line. In the acceleration and the kinetic energy graphs the line of best fit was very similar with the normal line whilst in the speed graph, there was no stability because of the terminal speed towards the end. My results were reliable and there were no anomalous results. If you had to be precise than maybe the 1st attempt of 16cm was a little bit inaccurate and also the 1st Attempt of 32cm was also a little bit inaccurate. In my table I have calculated acceleration, but this calculation is wrong, and the only way to find acceleration is to use the ticker timer (in method.) Acceleration calculations are wrong and this is noted on the result table. I only found out after I did my results table that acceleration cannot be calculated without a ticker - timer.
Evaluation: I have enjoyed doing this experiment, this experiment has vastly improved my research skills with using books from the library and using the Internet more efficiently. This experiment has made me think about all the factors of an investigation not just the prediction, method and results. With any school experiment, the experiment is not 100% fair. But the experiment is right to a degree of accuracy and this enough to grasp the main idea. Even though the experiment was not a 100% fair it is fair enough, in the end we concluded the same thing as the professional scientists, who have the advanced technology to carry out experiments precisely. In this investigation we decided to change the gradient of the ramp by varying the height of the ramp. Instead of using wood blocks, which were at different heights, we used a flight of stairs. We measured the height of the step above the ground. This is why our height goes up in 16cm because that was the difference between each step. The height of the steps had to be measured with a metre stick so they were not precise but they were fairly accurate. If I had to do this experiment again I would change my method in order to make the experiment fairer. I would make sure that: -
. After each experiment we cleaned the ramp with a cloth, to make sure that there was
no dirt which could affect the speed of the trolley as it travelled down the ramp.
2. Before we let go off the trolley, I held the ramp so that it would not tilt and therefore
it would not interfere with the speed of the trolley as it travelled down the ramp.
These above factors will also give me more accurate and reliable results. People consider accurate and reliable results as the same kind of result but it is not. Accurate results are
results, which are right or correct results. A reliable result means, every time you carry out the experiment they are almost identical results. For example a normal weighing scale might give you reliable results, which gives you the same results each time you do the
experiment but they are not as accurate as if you measure with a digital scale. I believe that my results are reliable but not accurate because we had limited resources to carry out the experiment with. Looking at my results they do follow a pattern and a trend. Both the
potential and kinetic energy go up as the height increase but more potential than kinetic. The acceleration of the trolley is more than the speed of the trolley and both the kinetic energy and acceleration graphs are almost identical. I have no anomalous results but two
inaccurate results, which do not fit in with the rest of the attempts at the same heights. This may have happened because the person timing the trolley may have pressed the
digital stopwatch's stop button too late. Even though two of my results are a little inaccurate on the whole my results are reliable and I believe that you can draw a firm conclusion from them. My results do tell the basic idea that if the gradient of the ramp is increased so is the speed of the trolley and using Hi-Tec equipment will also give you the same conclusion. I believe the only other way of getting more accurate results is to use more accurate and precise equipment.