Investigating a ski-jump
Aim:To investigate how the starting position of a ski jumper affects the horizontal distance travelled in the jump. I will not take air resistance, friction and other various type of energy lost into account, however in practical I have to keep in mind that they do exist and cause variation in my results.
Introduction
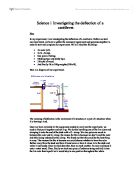
Ski jumping is a sport event that involves a steep ramp and a landing zone, where the skier has to travel as far as possible after leaving the ramp horizontally. When the skier is in motion in the air and the range it reaches is what I am investigating. This motion is called the projectile motion and the displacement, velocity and acceleration of the projectile are all vector quantities. Each of these can be placed into vertical and horizontal components. In my experiment, I will create a similar model of the ski jump using a plastic curtain rail as the slope and model the skier as a particle, in this case, a ball bearing.
Diagram This is a diagram of the basic equipment setup
This investigation has much room for expansion on the original above setup. The accuracy can be improved using a combination of more sensitive measuring equipment and a more accurate measuring setup.
Background Knowledge
Speed = Distance Re-arrange
Time
Range = Velocity x Time
X= VT..........Equation 1
To find the range (x), the velocity and time must be found.
m=mass, kg
h=height1, m
H=height2, m
v=velocity, ms-¹
s=displacement (the range), m
u=initial velocity, ms-¹
t=time, s
a=g=9.8, ms-²
Assuming no energy is lost, potential energy is equal to kinetic energy by the law of conservation of energy.
Velocity
GPE=KE (GPE= mg?h)
mg?h=1/2mv² (KE=1/2mv²)
mg?h=1/2mv² Masses cancel
/2v²=g?h x2
v²=2gh V
v=V(2gh) ........... Equation 2
Time
By using the equation of linear motion, s=ut+1/2at²
s=0+1/2at² vertical velocity = 0
H=1/2at² a=g
H=1/2gt² x2
2H=gt² ÷ g
2H/g=t² V
t=V (2H/g) ........... Equation 3
Equations 2 and 3 can now be substituted into equation 1.
Range(x)=Velocity(v) x Time(t)
R=V(2gh) x V(2H /g) g cancels out
R=V(2h) x V(2H)
R=V(4hH)............ Equation 4
Assumptions
. The friction between the ball and the curtain rail, along with the air resistance are neglible, therefore, will not be accounted for in this experiment.
2. The ball bearing is taken as a point, as the motion of a rolling ball differs from anything else.
3. Gravity does not affect the horizontal velocity
Prediction/Hypothesis
I have based my prediction on the calculated formula R=V(4hH)
The height of the table H is measured to be 92cm and is to remain constant
h (cm)
H (cm)
4H (cm)
R² (h x 4H)
R (VR²)
5
92
368
840
42.9
0
92
368
3680
60.7
5
92
368
5520
74.3
20
92
368
7360
85.8
25
92
368
9200
95.9
30
...
This is a preview of the whole essay
Prediction/Hypothesis
I have based my prediction on the calculated formula R=V(4hH)
The height of the table H is measured to be 92cm and is to remain constant
h (cm)
H (cm)
4H (cm)
R² (h x 4H)
R (VR²)
5
92
368
840
42.9
0
92
368
3680
60.7
5
92
368
5520
74.3
20
92
368
7360
85.8
25
92
368
9200
95.9
30
92
368
1040
05.1
35
92
368
2880
13.5
40
92
368
4720
21.3
45
92
368
6560
28.7
50
92
368
8400
35.6
Apparatus
Apparatus
Use
Curtain Rail
This will be used as a ramp for the ball to roll down
Ball Bearing
Object that models skier as a particle
Meter Ruler
Will be used to measure the range (x) travelled by the ball and the height (h) of the starting position. Measurements recorded in metres.
Set square
To make sure the height obtained is perpendicular to the table
G-Clamp
This will clamp the curtain rail to the table
Table
Where the slope will be placed on and clamped to
Sand Tray
This will be placed on the floor in the spot where the ball will land, leaving its mark.
Method
Variables
Controlled Variables
Constants
Launching position
Height of table
Acceleration due to gravity
Time of flight
Mass of ball
Velocity
. Test all equipment to make sure there are no problems and also test the sensitivity of the sand tray.
2. Set up appartus as show in diagram.
3. Check all apparatus are set up correctly and clamps are tightened securely
4. Using the meter ruler mark the 1st height at which the ball will be dropped from.
In my case, I am recording 8 different heights ranged 0.20m - 0.55m. Each within a 0.05m interval.
5. Using the set square against the height, the exact position of the ball is determined.
6. The ball is manually held in place at the desired height and released, allowing the ball to roll down the ramp and off the edge of the table, landing on the sand.
7. The distance from the edge of the table to the mark made in the sand is measured and then recoded.
8. This is process is then repeated untill all results have been collected.
Safety Precautions
There are few minor risks in doing this experiment, which with careful setting up and appropriate behaviour, can be avoided. These are:
> When bending down to record measurements of the range, it is possible to bas your head coming up. Simply be aware of your surroundings.
> Having a sand pit on the floor can prove to be an obstruction to passers-by and can be a hazard of tripping over. I will make sure there are no obstructions by the landing zone when in practise.
> The ball bearing is heavy enough to cause injury to anyone if hit by it. Keeping distance should prevent this.
Data interpretation
Alongside doing the experiment I will plot a graph. This will allow for any correlations to be spotted early on and then further predictions to be made. It will also allow the investigattion of anomalies. Therefore drawing a graph alongside the experiment allows for greater scientific accuracy and better end results.
Sensitivity
The sensitivity of this experiment is concerned with by the accuracy of the equipment available. For example, a much more accurate measuring device can be used to distinguish to an accuracy of ±0.1mm, but the ruler markings are only accurate themselves to ±1mm. Therefore, this creates a small error and show that to get the best out of the results, the most accurate equipment should be used in all situations.
Accuracy
The accuracy of this experiment can be improved in a number of ways:
> When reading the ruler the eye must be at the same level as the object, otherwise an incorrect value will be seen.
> The range measuring ruler must measure from the point the ball leaves the ramp, which in this case is the edge of the table. This means that it must be accurately aligned under the table, this can be achieved using a plumb line. It is facing directly downwards, allowing the ruler to be placed directly under the point at which the ball leaves the ramp. There may be a small error in the position of the plumbline of about ± 2mm.
> The sand in which the ball drops into may be uneven and the mark made when the ball strikes the sand may prove to be difficult to measure precisely.
> A travelling microscope could be used to measure the precise impact with the sand. But considering the level of accuracy used throughout the rest of the experiment, this would be an inefficient method.
Results
Height h/cm
Height
Distance x/cm
Distance x² /cm²
xmean
H/m
/cm2
st
2nd
3rd
Mean
st
2nd
3rd
Mean
st
2nd
3rd
5
5
5
5.0
0.92
31.0
31.5
31.5
31.33
961.00
992.25
992.25
981.833
0
0
0
0.0
0.92
46.0
45.5
45.5
45.67
2116.00
2070.25
2070.25
2085.500
5
5
5
5.0
0.92
58.0
57.0
58.5
57.83
3364.00
3249.00
3422.25
3345.083
20
20
20
20.0
0.92
65.0
64.0
64.0
64.33
4225.00
4096.00
4096.00
4139.000
25
25
25
25.0
0.92
71.5
71.0
71.5
71.33
5112.25
5041.00
5112.25
5088.500
30
30
30
30.0
0.92
77.0
76.0
75.5
76.17
5929.00
5776.00
5700.25
5801.750
35
35
35
35.0
0.92
81.5
82.5
81.0
81.67
6642.25
6806.25
6561.00
6669.833
40
40
40
40.0
0.92
87.0
87.5
84.5
86.33
7569.00
7656.25
7140.25
7455.167
45
45
45
45.0
0.92
90.0
90.5
89.5
90.00
8100.00
8190.25
8010.25
8100.167
50
50
50
50.0
0.92
93.0
94.0
93.0
93.33
8649.00
8836.00
8649.00
8711.333
There were no anomalous results recorded in this experiment
Error in distance x
To calculate the positive error in x, the Xmean value is taken away from the Xmax value.
To calculate the negative error in x, the Xmiin value is taken away from the Xmean value.
Distance x² /cm²
xmean
xmax
xmin
Positive Error
Negative Error
/cm2
/cm2
/cm2
/cm2
/cm2
st
2nd
3rd
961.00
992.25
992.25
981.83
992.25
961.00
0.42
20.83
2116.00
2070.25
2070.25
2085.50
2116.00
2070.25
30.50
5.25
3364.00
3249.00
3422.25
3345.08
3422.25
3249.00
77.17
96.08
4225.00
4096.00
4096.00
4139.00
4225.00
4096.00
86.00
43.00
5112.25
5041.00
5112.25
5088.50
5112.25
5041.00
23.75
47.50
5929.00
5776.00
5700.25
5801.75
5929.00
5700.25
27.25
01.50
6642.25
6806.25
6561.00
6669.83
6806.25
6561.00
36.42
08.83
7569.00
7656.25
7140.25
7455.17
7656.25
7140.25
201.08
314.92
8100.00
8190.25
8010.25
8100.17
8190.25
8010.25
90.08
89.92
8649.00
8836.00
8649.00
8711.33
8836.00
8649.00
24.67
62.33
Analysis
From looking at the graphs, a positive correlation between the squared value of the range and the height the ball is dropped from can be seen, although points vary from the line of best fit.
The results prove that the equation is correct and that the range of a ball does depend mostly on the height it is dropped from and the height the ball leaves the ramp. The formula (R²=4Hh) states that an increase in the drop height, h, increases the range of the ball. The results have proved this and my prediction to be correct.
However, the percentage at which the graphs agree to this equation is:
H = 92cm
4H = 368cm (expected)
Gradient of distance² graph = 192.3 (experimental)
Expected gradient = 368
92.3 x 100% = 52.3% agreement.
368
Conclusion
In conclusion the experiment occurs the following way:
The ball is released with high gravitational potential energy as it rolls down the slope, this energy is converted into kinetic energy, the higher the drop height, the longer the ball is travelling down the slope, so more energy can be transferred giving more kinetic energy and hence more speed when the ball leaves the ramp.
From the results it is also seen that there are other factors that affect the range as the gradient was smaller than expected. The equation is correct, but the only part that could affect the results in this way was the assumption that all energy was transferred. The transfer is likely to be less efficient than assumed, 100% energy transfer from potential energy to kinetic energy is extremely unlikely. The energy can be lost in a variety of ways which are the limitations.
Limitations
> Air resistance is an important limiting factor as it would have the most affect on the results. This was not counted for when doing the experiment and therefore has some affect on the results. As the ball moves through the air, the air itself is putting up a resistance against the ball, lowering its speed, and its distance travelled.
> Air resistance is dependant on the size of the object, as the larger the object the more air it has to push to the side. It also depends upon the speed at which the object is travelling, as an object travelling at faster speeds has to push aside more air in the same time.
> This effect can be used to explain the slight curvature at the top of the graph. This is because the ball is travelling at higher speeds (because it is being dropped from greater heights), with more air resistance acting upon it due to the higher speeds, causing it to cover less distance.
Evaluation
The trend of the graph 2 is a very clear with a positve correlation. There can be three different ranges of the line of best fit but I have only drawn the most obvious one.
The 1st line of best fit can be drawn from the origin through the top ends of the error bars, whereas the 2nd can be drawn through the bottom ends of the error bars. However, due to the error bars being so small, it will be very difficult to show these 3 lines together.
The accuracy and sensitivity of the apparatus leaves a minor error in the results giving a range of different values for that particular result.
Ie. At a height of 5cm, the mean result was 31.33cm. However this can actually be smaller or bigger than this value considering the errors in apparatus. The position of the plumbline to mark the the edge of the table will have an estimated ±2mm, having to join 2 meter rulers together will have an estimated ±1mm and judging the landing position of the ball will also have a ±2mm effect on the results. In total the range of values for the results will be ±5mm. Therefor the range of values for 31.33cm would be 30.83cm - 31.83cm.
Percentage error
I will take the maximum result of the range and calculate the percentage error based on the uncertainty values.
% error of range, x, 93.33cm ± 0.5cm
0.5cm ÷ 93.33cm x 100% = 0.53%
The values are vastly small and so are not worth considering.
Improvements
If this investigation were to be repeated, there are a few things I would like to change.
Firstly, I would ensure to take more care that the above factors were fully compramised and minimised.
Furthermore, I would take a much larger range of results to provide a more reliable end result, taking fairness of the experiment into account much more seriously.
Finally, I would use a much more accurate range of apparatus to get the most accuracy in my results. For example, a specialised light gate can be set up at the end of the ramp to dictate the exact speed at which the ball leaves the ramp. This could then be considered with the mass to calculate the kinetic energy and gravitational potential energy and hence the total energy loss.
Bibliography
> Salters Horners Advanced Physics
> Various web pages for research
Scott Jenkins