Is there a link
between ability in Maths and ability in Science?
An Example Of A Higher Tier Data Handling Project
Introduction
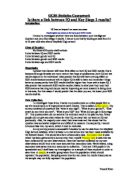
I would like to know whether there is a link between ability in Maths and in Science in the Year 7, 8 and 9 students at Mayfield High School. My initial thoughts are that there is a link between the two because Maths and Science share some of the same attributes - they both involve formulae, they both require logical ability, and they both use numbers. Furthermore, I think that someone with an interest in Maths will also have an interest in Science, and so will probably work hard at both.
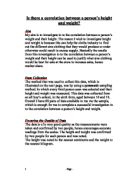
Data Collection
To investigate this link, I will use the Key Stage 2 results from the Mayfield High School database. There are 813 Year 7, 8 and 9 students listed in the database, so to save time I will base my investigation on a sample of 30 of these students.
Bias is anything that occurs when taking a sample that might prevent the sample from being a true representation of its parent population. To avoid bias, I will ensure that my selection of the sample is completely random. To ensure a random selection, I will use a random number generator on my calculator. In the database, the students are numbered from 1 to 813. As the random numbers appear on my calculator, I will record the associated data in two or three tables, once for all 30 students, one just for males and one just for females. I have decided to do this as I suspect that any link between ability in Maths and in Science may also in turn be linked to gender.
Finally, before I collect my data, I will express one concern I have regarding the Mayfield High School database. Studying the database, I notice that one or two IQ values have been entered as low as 11 and 14. These are quite clearly inaccurate. I therefore fear some of the other data may have been inaccurately entered into the database. However, it is impossible to tell in the case of most of the other columns and therefore, I must simply resolve to just look out for any abnormalities in my calculations or diagrams that may be accounted to inaccurate data in the database.
After generating 30 random numbers, I now have the set of data shown in Appendix A at the rear of this project to base my investigation on.
Analysis
To start with, I will analyse the first table of data, where the data is not gender-specific. Before I show you my analysis, I will just mention that I have left out the zero values as I feel that these may be further evidence of inaccuracies within the database; any student granted a 0 in Maths and a 0 in Science would have been absent on the day and therefore these values will only distort my analysis.
So, to start, I will initially calculate the measures of spread and location listed in the table below:
Maths
Science
Mean
4
4.17
Mode
4
4 and 5
Median
4
4
Standard Deviation
0.87
0.87
[Table 1: Basic Measures of Spread and Location]
Studying the table, a first point to note is that if the mean and median are not exactly the same, they are indeed very close. This indicates that
there is little, if any, skewness in the data.
When the distribution of data is not symmetrical, it is known as a skew distribution. If the tail of the distribution extends in the direction of the positive axis, then the distribution is positively skewed and in the other direction negatively skewed. I will now calculate the coefficient of skewness associated with each of these sets of results to confirm that there is indeed little skewness in the data. Below is a table illustrating these values:
Skewness
Maths
0
Science
0.59
[Table 2: Coefficients Of Skewness]
As previously suggested, this table does indeed confirm that in both cases there is little, if any, skew ness in the data. I am pleased with this result because it therefore not only allows me to conclude that in both Science and Maths, the students on average scored a level 4 in their Key Stage 2 exams, but also suggest that since these scores are the same, there is a link between ability in Maths and ability in Science.
Moving away from calculations and onto diagrammatic representation, I will now extend my analysis to the use of scatter diagrams. With the xaxis as Maths and the y-axis as Science, I produced the scatter diagram inserted over the page.
Studying the scatter diagram, it is clear that there is a link between the Key Stage 2 results for Maths and Science; students who scored high in Maths were more than likely to have scored high in Science. Therefore, since positive correlation is clearly indicated by the scatter diagram, I can conclude that there is a link between ...
This is a preview of the whole essay
Moving away from calculations and onto diagrammatic representation, I will now extend my analysis to the use of scatter diagrams. With the xaxis as Maths and the y-axis as Science, I produced the scatter diagram inserted over the page.
Studying the scatter diagram, it is clear that there is a link between the Key Stage 2 results for Maths and Science; students who scored high in Maths were more than likely to have scored high in Science. Therefore, since positive correlation is clearly indicated by the scatter diagram, I can conclude that there is a link between ability in Maths and ability in Science.
For all intents and purposes, having now established, on the basis of my sample of 30 students, that there is a link between ability in Maths and ability in Science, I have now fulfilled my aim and could conclude my project. However, having already separated my sample data into a male / female divide, I shall see whether the link between ability in Maths and ability in Science is in turn linked to gender.
To extend my analysis in such a manner, I will now repeat the previous calculations for the second and third tables in appendix A at the rear of this project. Below are two tables to show the result of my calculations:
Males
Females
Maths
Science
Maths
Science
Mean
4.13
4.20
3.86
4.14
Median
4 and
4
4
5
Mode
4
4
4
4
Standard Deviation
0.88
0.83
0.83
0.91
Skewness
Males
Females
Maths
0.44
-0.51
Science
0.72
0.46
[Tables 3 and 4: Male / Female Measures Of Spread And Skewness]
Studying these values together with the combined scatter diagram inserted over the page, I can reach a conclusion. With the coefficients
of skewness approximately the same as before, I can once again conclude that on average, regardless of their sex, the students scored a level 4 in both their Maths and their Science Key Stage 2 exams, and that there is a link between ability in Maths and ability in Science. However, if we study the scatter diagram further, we can see that this is not all it suggests! While both male and female students who scored high in Maths were more than likely to have scored high in Science, two further statements can also be made:
• On average, both the male and female students showed greater ability in Science than in Maths.
• On average, the link between ability in Science and in Maths is greater for male students that for female students.
Since both these statements interest me and require further analysis to quantify, I shall now investigate whether there are any mathematical techniques that could be used to do so.
Flicking through the `Advanced Modular Mathematics: Statistics 1' published by Heinemann, I see that you can calculate a measure of the correlation in the scatter diagram. This measure is called the productmoment correlation coefficient and is considered powerful as it is independent of sample size and the scales of measurement used. I will now calculate a separate product-moment correlation coefficient for the males and for the females to indeed confirm that the link between ability in Science and in Maths is greater for the male students than the female students. Below is a table illustrating these values:
Product-Moment Correlation Coefficient
Males
Females
0.96
0.68
[Table 5: Male / Female Product-Moment Correlation Coefficients]
The calculation of the product-moment correlation coefficient is such that it will lie between 1 and -1, with 1 meaning that there is perfect
positive correlation, 0 no correlation and -1 perfect negative correlation. From the above values, we can clearly see that the link between ability in Science and in Maths is greater for the male students than the female students since the males' coefficient is far closer to 1 than the females. Therefore, while the relationship between Maths and Science for both the males and females is positive correlation, there is clearly a greater link between ability in these two subjects for the males than for the females.
I have now addressed the second of my earlier statements, but have yet to confirm that, on average, both the male and female students showed greater ability in Science than in Maths. Flicking on through the A' Level Statistics book, I see that the line of best fit I would normally draw by inspection can actually be calculated. We call this calculated line the least squares regression line.
I will now calculate such a line for the males and then for the females, and compare these lines to the line, y = x. If the students were of a truly equal ability in Maths and Science, then the line of best fit for the scatter diagram would fit the equation, y = x where Maths is the x-axis and Science is the y-axis. However, as seen, the students are not all of an equal ability in Maths and Science, and therefore the production of a least squares regression line which is above the y = x would confirm that the students, on average, showed a greater ability in Science than in Maths. Below is a table to show the result of my calculations:
Least Squares Regression Line
Males
Females
y=0.48+0.90x
y=1.25+0.75x
[Table 5: Male / Female Least Squares Regression Lines]
Studying the equation of these lines together with their graphical representation inserted above, I can reach a conclusion. Throughout the range of levels at Key Stage 2, that is 2 through to 5, we can see that the least squares regression line for the males and the females is above the line y= x. Beyond 5, we can see the line crosses the y= x line, but since this is beyond the range of available levels at Key Stage 2, I do not need to worry about this occurrence. I can therefore conclude that since the least squares regression lines are above the y= x line from 2 through to 5, then both the sexes showed a greater ability in Science than in Maths, and in particular, the females more so than the males.
Having now confirmed my two earlier statements, it would appear that I have completed my investigation. However, it strikes me that I have so far carried out all these calculations without any reference to the year group within which the students lie. I therefore feel that to complete my analysis and in turn my investigation, I will now focus on whether the link between ability in Maths and in Science varies with each year group.
Data Collection (2)
To investigate whether the link between ability in Maths and in Science varies with each year group, I will still use the Key Stage 2 results from the Mayfield High School database. However, since I now know that the link between ability in Science and in Maths is greater for male students than for female students, I will now base my investigation on a stratified sample of 20 students from each year group.
Earlier, I mentioned the need to avoid any bias; that is to avoid anything that might prevent the sample from being a true representation of its parent population. I have therefore decided to take a stratified sample as it will ensure that I base my investigation on a group of 20 male and female students from each year group that are in proportion to the number of male and female students in that group. Through such caution, I will eliminate any possible distortion that may have occurred through choosing a sample that is predominantly male or female when the year group is not divided in such a way.
To take a stratified sample, I now need to know the number of males and females in Year 7, 8 and 9 at Mayfield High School. To quickly ascertain such information, I will `sort' the database into year groups and then a male/female divide. The results of the `sort' are summarised in the table below:
Year 7
Year 8
Year 9
Males
Females
Males
Females
Males
Females
51
31
45
25
18
43
282
270
261
[Table 7: Male/Female Divide In Years 7, 8 And 9]
As stated earlier, I have chosen to take a stratified sample of 20 students from each year group. Using the above table, I am now in a position to
calculate the number of males and females that will be in each of these samples. Below is table to show the result of my calculations:
Year 7
Year 8
Year 9
Male
Females
Males
Females
Males
Females
1
9
1
9
9
1
[Table 8: Male/Female Stratified Sample]
Now that I know the number of males and females that I want in my sample of 20 from each year group, I will collect my data. To do so, I will use the same strategy as earlier in my investigation; I will generate the required number of random numbers on my calculator and then record the associated data in a set of tables.
I now have the data shown in appendix C at the rear of this project.
Analysis (2)
To ascertain whether the link between ability in Maths and in Science varies with each year group, I need to identify the strength of the relationship between these subjects in each of the year groups. Looking back through my previous analysis, I therefore feel that the most efficient method to once again adopt is the calculation of the productmoment correlation coefficient for each year group and then compare these.
So, to extend my analysis in such a manner, I will now carry out the required calculations for my new set of data. Below is a table to show the result of my calculations:
Product-Moment Correlation Coefficient
Year 7
Year 8
Year 9
0.61
0.74
10.85
[Table 9: Year 7/ 8/ 9 Product-Moment Correlation Coefficients]
As we know from before, the calculation of the product-moment correlation coefficient is such that it will lie between 1 and -1, with 1
meaning that there is perfect positive correlation, 0 no correlation and -1 perfect negative correlation. From the above values, we can clearly see that, on the basis of a stratified sample of 20, the link between ability in Maths and ability in Science is greater in Year 9, than in Year 8 and in turn, than in Year 7. Therefore, while the relationship between Maths and Science for all the year groups is positive correlation, the link does appear to vary and I can indeed conclude, that it has decreased with each new year group coming into the school.
Conclusion
The original aim of my investigation was to establish whether there is a link between ability in Maths and in Science in the Year 7, 8 and 9 students at Mayfield High School. Through data collection and analysis, I not only fulfilled this aim but extended my investigation to incorporate whether a link between ability in Maths and in Science was in turn linked to gender or age.
Initially, on the basis of a sample of 30 students, I identified that there is a link between ability in Maths and ability in Science; on average, a student who scored a level 4 in their Key Stage 2 Maths exam also scored a level 4 in their Key Stage 2 Science exam. Further to this, I also established that on average, the link between ability in Science and in Maths was marginally greater for the male students than for the female students, and that both the male and female students showed themselves to be slightly more able at Science than Maths.
Finally, on the basis of a stratified sample of 20 students from each year group, I identified that ability in Maths and in Science does vary with each year group and that at Mayfield High School, the link between the two subjects has decreased with each new year group coming into the school in the last three years.
I have now come to the end of my investigation. To reach the above conclusions, and learn new statistical skills such as the calculation and interpretation of the product-moment correlation coefficient and the least squares regression line, has been both a rewarding and interesting experience. I could have analysed the data in many more ways than I have done, but I feel that these techniques would not have given me any more of an insight than that which I have gained. My only regret is that a lack of time prevented me from:
(1) Taking larger samples; a stratified sample of merely 20 students is a small sample on which to establish a reliable conclusion.
(2) Attempting further study into a link between gender and age; a stronger link may exist between say, females in Year 7 than females in Year 9.
[Please note that an Appendix now follows in which I have included all data and calculations used throughout my investigation.]
Appendix A
Mixed
Males
Females
Maths
Science
Maths
Science
Maths
Science
4
4
4
4
5
5
4
4
4
4
2
3
5
5
5
5
4
4
2
3
4
4
0
0
4
4
3
4
4
5
0
0
2
2
3
4
5
5
5
5
4
4
4
4
4
4
4
5
3
4
4
4
3
2
4
5
3
3
5
5
2
2
5
5
4
4
5
5
5
5
5
5
3
4
5
5
4
5
4
4
5
5
4
3
4
4
4
4
3
4
4
5
4
4
3
2
3
3
5
5
5
5
5
5
4
4
5
5
5
5
5
5
4
5
4
4
4
3
3
4
Appendix B
Calculations For Table 8:
Year 7 Males Stratified Sample = (151/282) x 20 =11
Year 7 Females Stratified Sample = (131/282) x 20 = 9
Year 8 Males Stratified Sample = (145/270) x 20 =11
Year 8 Females Stratified Sample = (125/270) x 20 = 9
Year 9 Males Stratified Sample = (118/261) x 20 = 9
Year 9 Females Stratified Sample = (143/261) x 20 =11
Calculations For Tables 1 and 2:
Mixed Maths
x
Frequency
(f)
fz
fx
2
3
4
5
2
5
3
9
4
5
52
45
8
45
208
225
29
16
486
Mixed Science
(y)
Frequency
(f)
fy
fy2
2
3
4
5
2
3
2
2
4
9
48
60
8
27
92
300
29
21
527
Calculations For Tables 3 and 4:
Males Maths
(x)
Frequency
(f)
fx
fx2
2
3
4
5
2
6
6
2
6
24
30
4
8
96
50
5
62
268
Males Science
(y)
Frequency
(f)
fy
fy2
2
3
4
5
7
6
2
3
28
30
4
9
12
50
5
63
275
Calculations For Tables 3 and 4:
Females Maths
(x)
Frequency
(f)
fx
fx2
2
3
4
5
3
7
3
2
9
28
5
4
27
12
75
4
54
218
Females Science
Frequency
fy
fy2
2
3
4
5
2
5
6
2
6
20
30
4
8
80
50
4
58
252
Appendix C
Year 7
Maths
Science
Males
4
4
5
4
3
4
5
3
4
5
4
4
4
4
4
3
3
5
4
4
5
4
Females
3
5
4
5
4
4
4
4
5
4
5
4
4
4
4
5
4
5
Year 8
Maths
Science
Males
4
4
4
5
5
5
4
4
5
4
5
4
3
4
5
5
5
5
4
5
4
5
Females
5
4
4
5
5
4
4
3
4
5
4
4
5
5
4
4
4
3
Year 9
Maths
Science
Males
4
4
4
5
4
4
5
5
4
4
3
4
5
4
5
5
5
4
Females
4
5
5
3
3
4
4
4
3
5
5
4
5
4
3
3
4
4
4
3
5
5